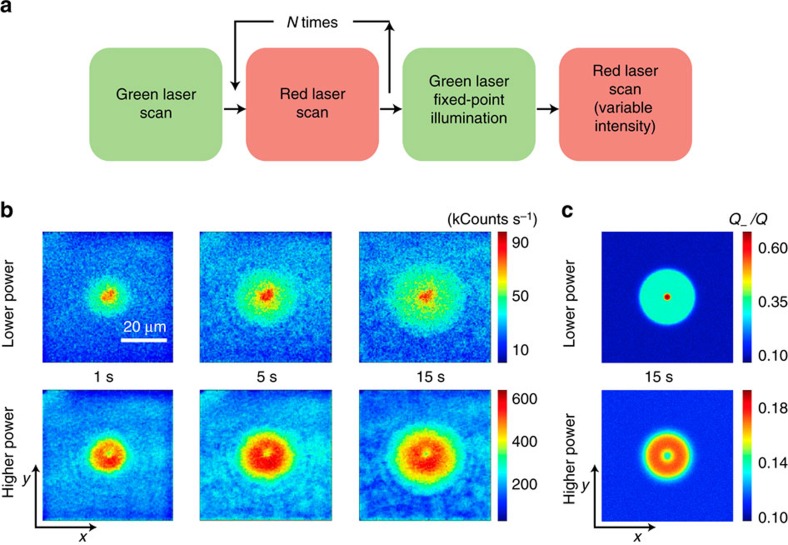
Figure 3. Mapping NV− patterns from fixed-point green-light excitation.
(a) On initializing the area via a strong green laser scan, we repeatedly scan the red beam to bleach the system fluorescence. We then point the green laser beam to a fixed point and illuminate for a fixed time interval tG, to finally take a fluorescence image by scanning the red beam. (b) Fluorescence images on a readout scan in an area around the point of green illumination (∼1 μm diameter spot approximately at the centre). From left to right, the time tG of green laser illumination is 1 s, 5 s, and 15 s, respectively. Throughout the upper (lower) row of images, the red laser power during the readout scan is 100 μW (1.5 mW); in all cases the green laser power is 1.8 mW. All images share the same scale bar in the upper left and have a size of 150 × 150 pixels recorded with an integration time per pixel of 1 ms. (c) Calculated NV− distribution taking into account the effect of the red laser beam during scanning (100 μW for the top image and 1.5 mW for the lower image). The scale bar and axes labels in b also apply to all images in b and c. All parameters as listed in Supplementary Table 1.

