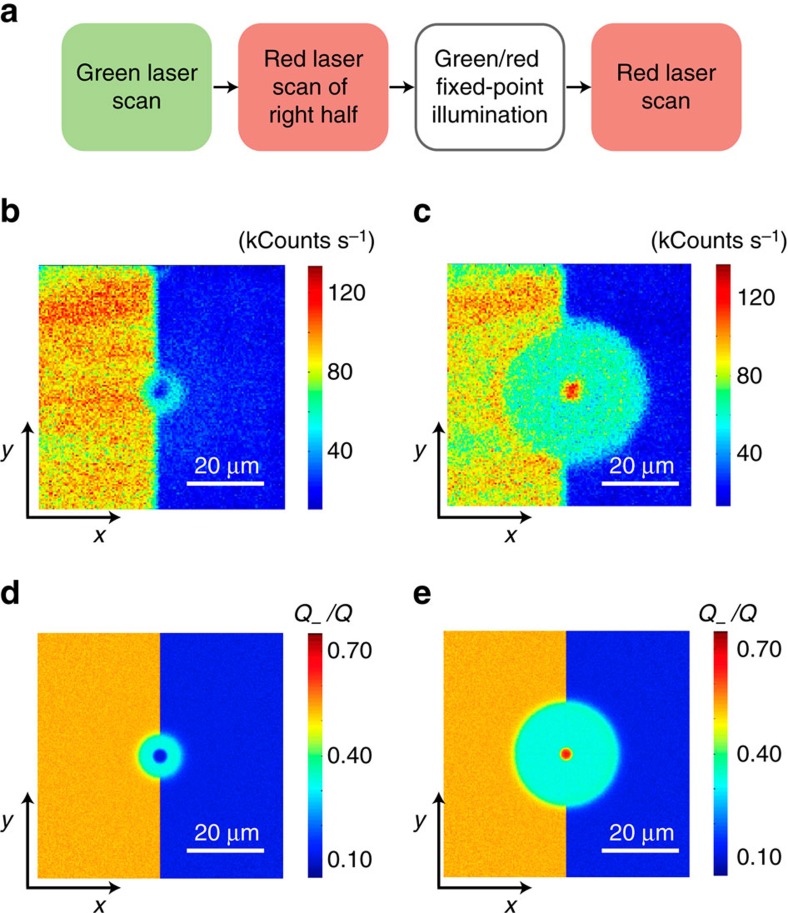
Figure 4. Pattern formation in the presence of heterogeneous NV− content.
(a) After initializing with a (green) reset scan, we ionize NV− on half the sample area via a strong (red) bleach scan; we then focus either the red or green laser to a point approximately at the centre for a fixed time interval, and finally image the result via (a low-intensity red) readout scan. (b) Fluorescence image on application of the protocol in a using red, fixed-point excitation during tR=10 s. The red beam power is 1.5 mW during the bleach scan, 1.5 mW during tR and 100 μW during the readout scan. (c) Same as in b but for green fixed-point illumination at 3 mW during tG=10 s. In b and c the image size is 150 × 150 pixels and the integration time per pixel is 1 ms. (d,e) Calculated NV− map for the conditions in b and c, respectively. Simulation parameters as listed in Supplementary Table 1.

