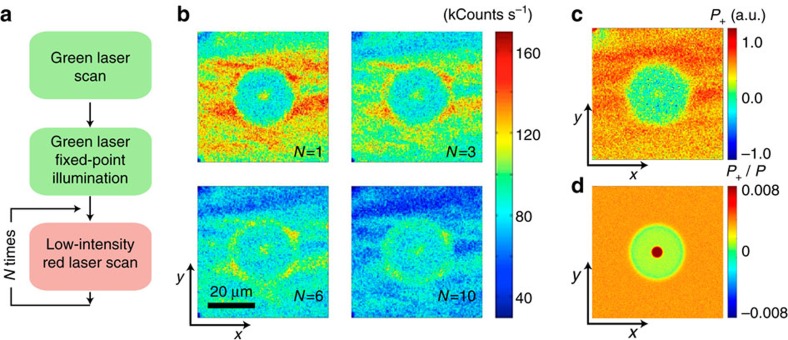
Figure 6. Determination of the relative content of positively charged nitrogen.
(a) Experimental protocol. After green, fixed-point illumination, the sample is image-scanned N times. (b) Resulting fluorescence images on N=1 (top left), N=3 (top right), N=6 (bottom left) and N=10 (bottom right) readout scans. Besides an overall reduction of the sample fluorescence, successive red scanning alters the image contrast due to site-dependent bleaching rates. (c) Map of positively charged nitrogen P+ as determined from the normalized bleaching rate at each point (see text). Most nitrogen impurities in the halo region are neutral. (d) Calculated P+ 2D map using the parameters listed in Supplementary Table 1. Images in b are 150 × 150 pixels and the integration time per pixel is 1 ms. The green and red laser powers are 1.83 mW and 110 μW, respectively. The green laser fixed-point illumination time is tG=15 s. The scale bar in b applies to all images in b and c.

