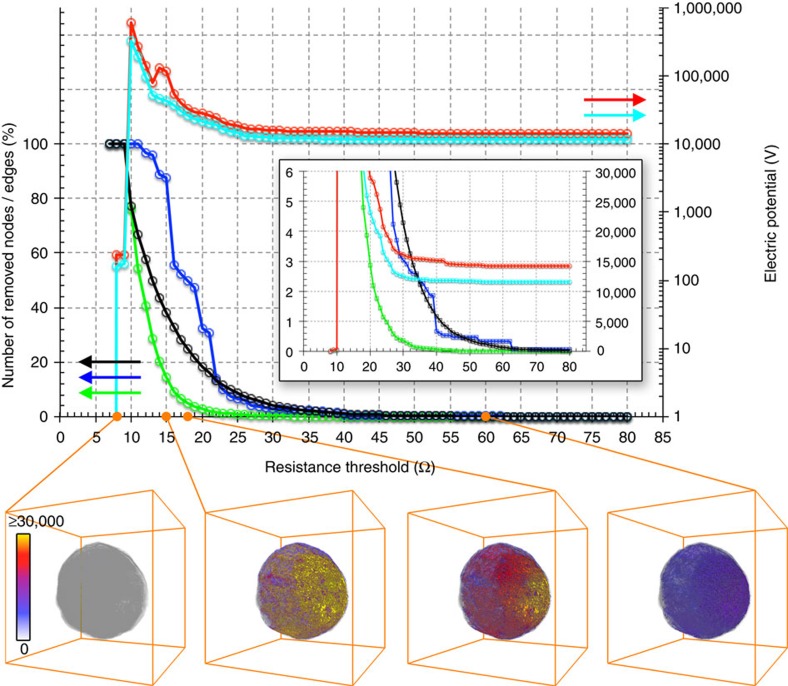
Figure 4. Simulated gradual ageing of the catalyst particle's pore network.
The response of the pore network of the FCC particle to pore blocking by the poisoning metals was tested by applying a series of resistance thresholds to remove pore channels (edges of the pore network) with resistance values above the respective threshold. The top part of the figure reports the number of edges that have been removed (in percentage of all edges of the network, black line), the number of source nodes (nodes in Zeolite domains, green line) as well as the number of sink nodes (nodes at the surface, blue line) that have been disconnected from the network (in percentage; a node is removed when there is no edge of the network left connecting to it), and the maximum (red) and average (cyan) pseudo-voltage determined for the network after the edges have been removed. The inset shows a zoom of the plots using a linear scale for the electric potential. In the lower part, a virtual cut through the 3D potential distribution as determined for the network after the pore channels have been removed is reported for the resistance thresholds 8, 15, 18 and 60 Ohm. The total particle volume is indicated in transparent grey. See also Supplementary Movie 2.

