
Fig. 4.
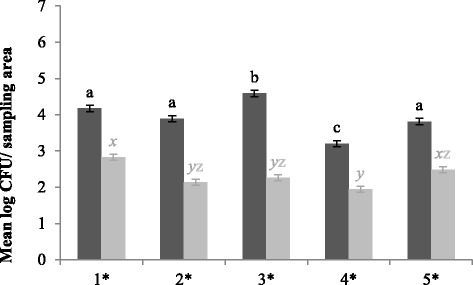
Mean spore enumerations in log colony forming units/sampling area for CE (dark grey bars) and control units (light grey bars) for each location. At each location, 108 samples were taken per type of unit. Significant differences between sampling moments within one type of unit are indicated by different letters above bars. Significant differences between protocols within one sampling moment are indicated by a star (*) on the horizontal axis. Vertical bars denote standard errors. 1, grid floor; 2, concrete wall; 3, synthetic wall; 4, drinking nipples; 5, feeding trough