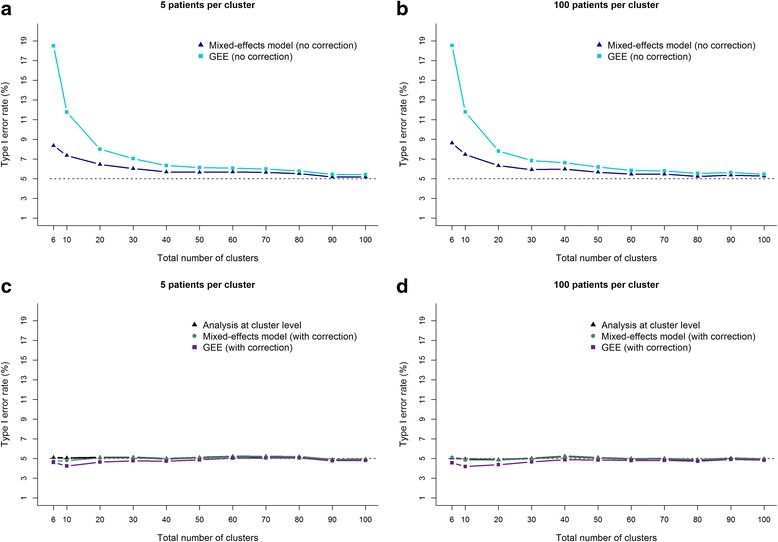
Fig. 1.

Association between type I error rate and number of clusters for ‘appropriate’ and ‘inappropriate’ methods of analysis. This figure presents the association between the total number of clusters and the risk of an inflated type I error rate for different methods of analysis. Panels a and b show the type I error rate for methods of analysis that are ‘inappropriate’ to use with a small number of clusters. Panels c and d show the type I error rate for methods of analysis that are ‘appropriate’ to use with a small number of clusters. The mixed-effects models in panels c and d used a Satterthwaite degree-of-freedom correction. The GEE models in panels c and d used the correction proposed by Fay and Graubard. Panels a and c represent a small cluster scenario (e.g. a family). Panels b and d represent a large cluster scenario (e.g. a hospital). The intraclass correlation coefficient (ICC; a measure of how correlated participants within a cluster are) was set as 0.15 for ‘small’ clusters (panels a and c), and as 0.01 for ‘large’ clusters (panels b and d). Data were estimated using simulation (50,000 replications per scenario)
