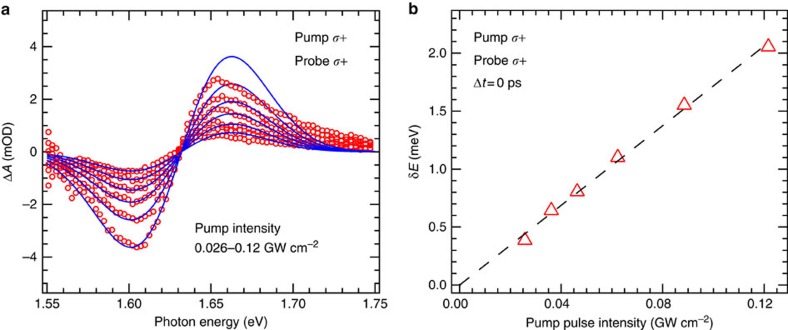
Figure 4. TA spectrum fitting and pump intensity-dependent energy shift.
(a) OSE-induced TA spectrum (red circles) for different pump intensities recorded at time zero. The blue traces are best fits to equation (2). (b) Shift of the exciton transition energy for different pump pulse intensities. The dashed line represents a linear fit of the data points. The average pump intensities are also listed in Supplementary Table 2.

