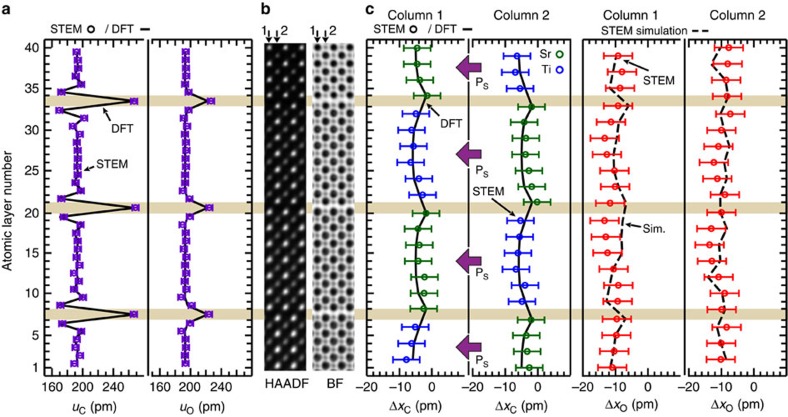
Figure 3. FE atomic columns in Sr7Ti6O19 film region #1.
(a) Cation uC and oxygen uO interatomic spacing (purple open circle) extracted from the drift-corrected HAADF and BF STEM images superimposed on the DFT calculated values (solid grey line). The characteristic decrease in interplanar spacing in uC and its absence in uO adjacent to the rock salt layers (horizontal beige colour rectangles across the panels) indicates rumpling in the atomic structure due to the rock salt layer. Exceptional agreement between experiments and DFT is seen. (b) Average experimental HAADF and BF STEM slices from region #1 of the sample. The slices are repeated for clarity. (c) Cation ΔxC (blue and green open circles) and oxygen ΔxO (red open circles) displacements along the [100]PC taken from the drift-corrected HAADF and BF images along with the superimposed FE DFT calculated positions (solid black line) and FE DFT simulated oxygen positions (dashed black lines). The simulated oxygen positions were performed with a 1.25 mrad tilt about the [001]PC axis (the simulation with the best agreement to experiment). The error bars are taken to be the root mean s.e. from the positions of a best fit lattice determined by CV.

