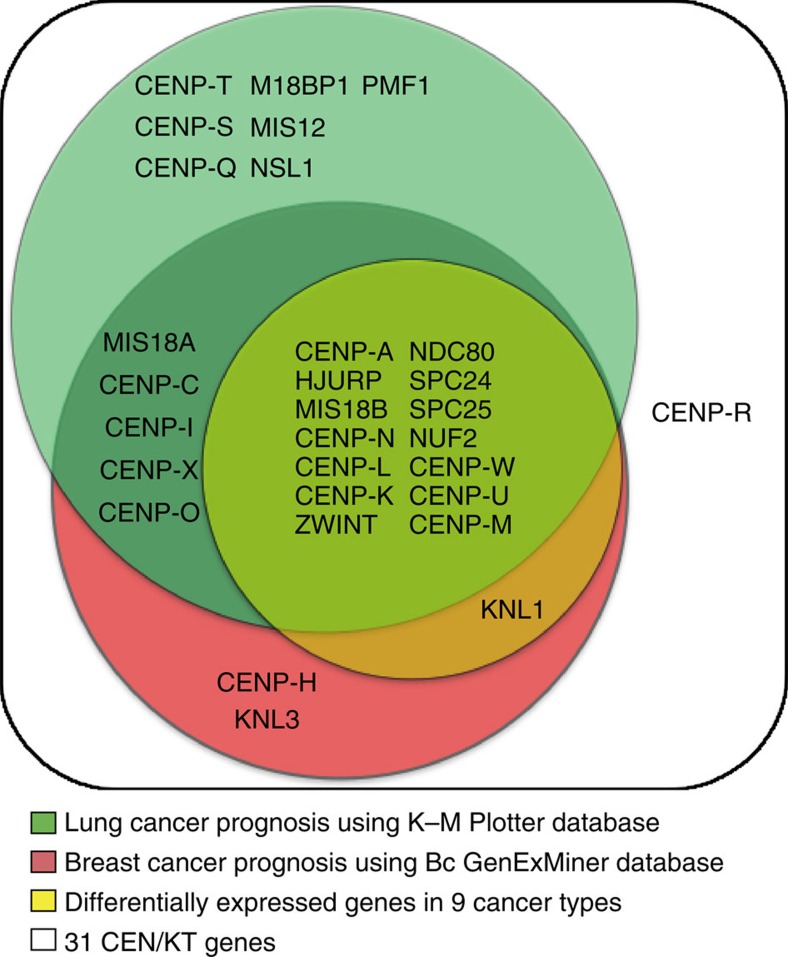
Figure 2. Venn diagram identifies 14 CEN/KT genes whose expression levels correlate with cancer progression.
White: All 31 CEN/KT genes. Yellow: CEN/KT genes that are differentially expressed in nine cancer types relative to their corresponding normal tissues as shown in Fig. 1b. Red: CEN/KT genes with significant prognostic values for breast cancer patients using BC-GenExMiner, and (green) those with significant prognostic values for lung cancer patients using K–M Plotter based on Affymetrix HG-U133A platform. Note that inclusion of five genes (CENP-W, CENP-K, CENP-L, NUF2 and SPC24) in the final core CEN/KT gene list was based on the upregulated gene list and BC-GenExMiner results (also see Methods).

