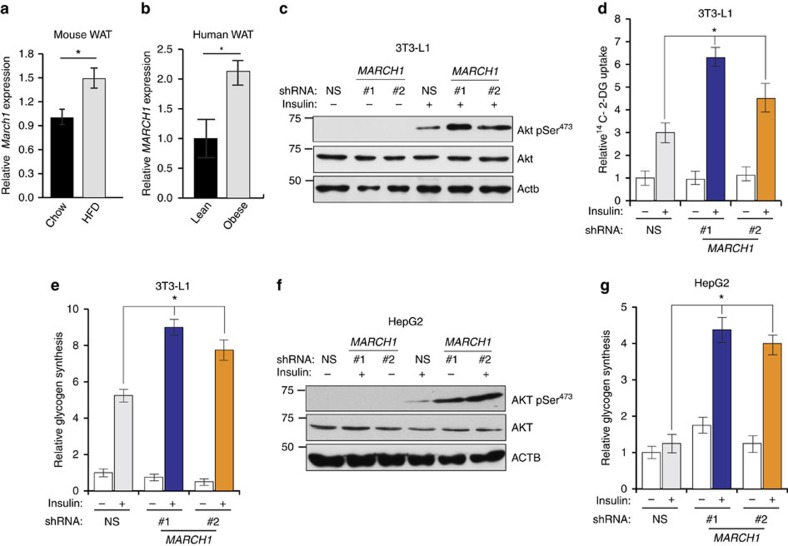
Figure 2. MARCH1 expression is increased in WAT from obese humans and mice and regulates insulin signalling in target tissues.
(a) qRT-PCR measurement of March1 expression in WAT of adult male C57BL/6 J mice fed either regular chow or high-fat diet. (b) qRT-PCR measurement of MARCH1 expression in WAT from lean (n=8) and obese (n=13) human adolescent subjects. (c) Immunoblot analysis of AKT Ser473 phosphorylation in differentiated 3T3-L1 adipocytes expressing indicated shRNAs. (d) Relative 14C-2-deoxyglucose uptake (n=4) in differentiated 3T3-L1 adipocytes expressing either NS or March1 shRNA. (e) Relative glycogen synthesis (n=3) in differentiated 3T3-L1 adipocytes expressing either NS or March1 shRNA. (f) Immunoblot analysis of AKT Ser473 phosphorylation in HepG2 hepatocytes expressing either NS or MARCH1 shRNA. (g) Relative glycogen synthesis (n=3) in HepG2 hepatocytes expressing either NS or MARCH1 shRNA. In d,e,g, *compares NS and MARCH1 shRNAs in presence of insulin. In all panels, data are mean±s.e.m. and *P<0.05, comparisons by t-test. qRT-PCR, quantitative real-time PCR.

