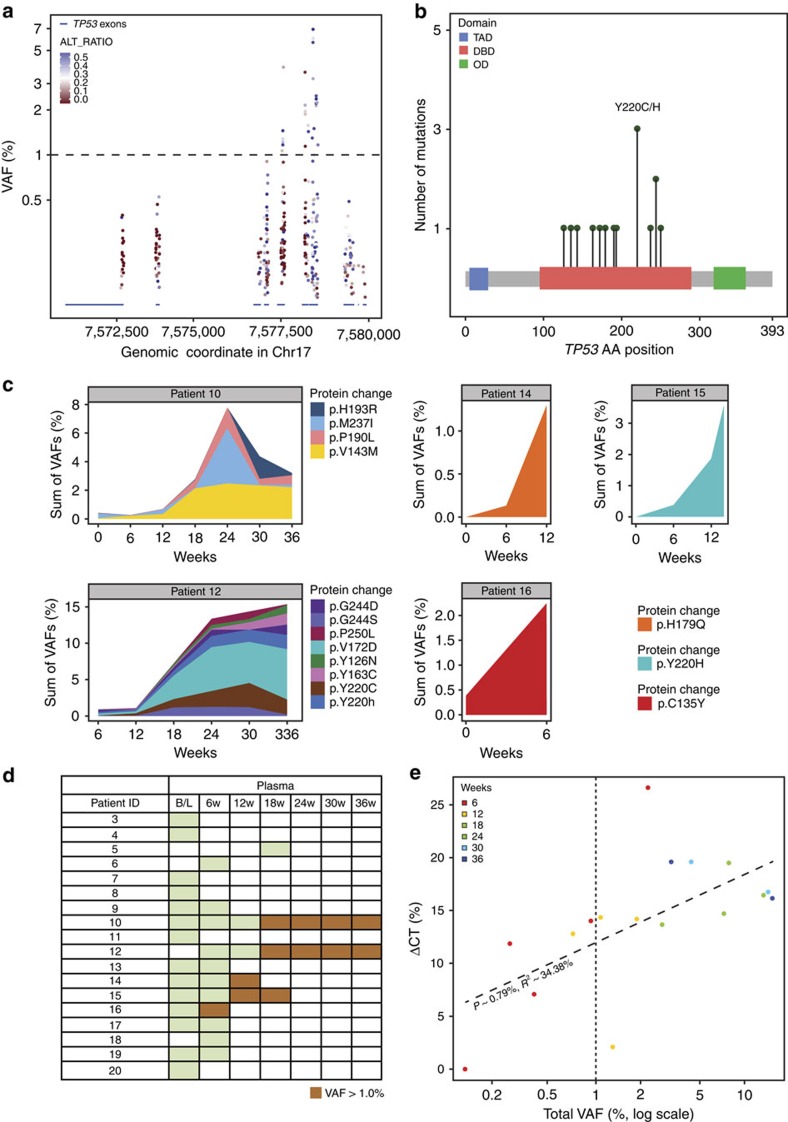
Figure 2. TP53 mutations in patients with DDLPS treated with the HDM2 antagonist SAR405838.
(a) TP53 mutation VAF in cfDNA samples from patients with DDLPS in the SAR405838 MTD expansion cohort. The X axis shows the genomic location of TP53 exons and UTRs (blue bars). Each dot indicates the presence of one TP53 variant. Dotted line indicates VAF of 1.0%. (b) All identified mutations in TP53 were located in the DNA binding domain. The Y axis is the number of mutations observed at each position; the X axis represents the amino-acid sequence of TP53. Each green dot represents a missense mutation. The most frequently altered amino-acid position (Y220) is indicated. (c) TP53 mutations at VAF >1.0% were clustered in five patients. The Y axis shows the sum of TP53 mutation VAF (allele burden) and the X axis shows weeks of treatment. Each mutation is represented by one colour. (d) Patient TP53 mutation status. Green indicates time points for which cfDNA samples were collected and sequenced, but no TP53 mutations were identified at VAF >1.0%. Orange indicates time points for which TP53 mutations were identified at VAF >1.0%. (e) Correlation between percent change in tumour size by CT (the Y axis) versus total TP53 mutation VAF (mutation burden; the X axis, log scale) across all patients for which at least one TP53 mutation was identified at VAF >1%. Each dot represents one time point for one patient and dots are coloured according to the time point. The vertical dotted line indicates TP53 mutation VAF=1.0%. B/L, baseline; cfDNA, cell-free DNA; CT, computed tomography; DBD, DNA binding domain; DDLPS, de-differentiated liposarcoma; MTD, maximum tolerated dose; OD, oligomerization domain; TAD, transactivation domain; VAF, variant allele frequency.

