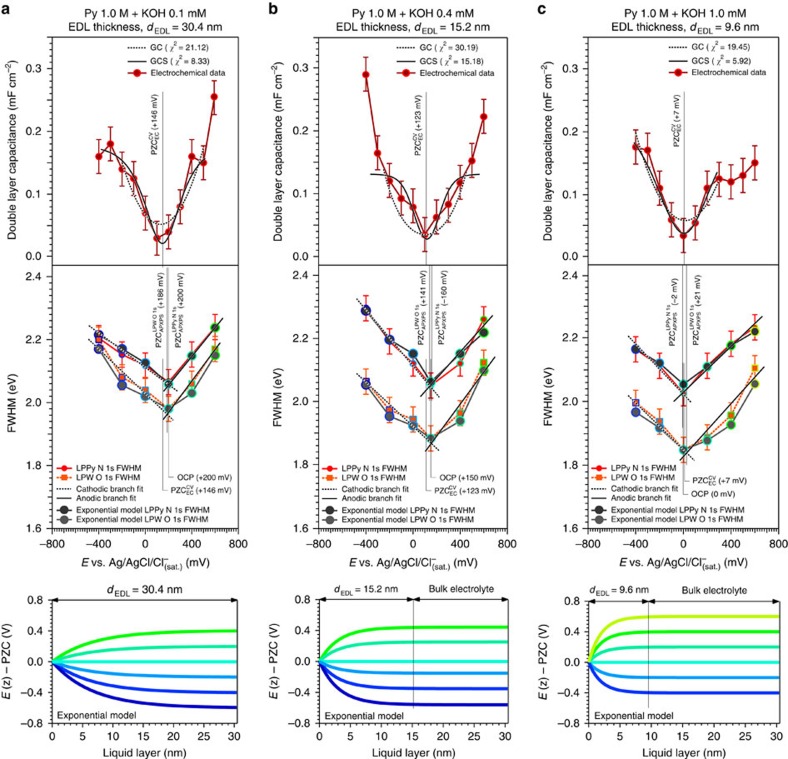
Figure 4. Electrochemical double layer probing and potential drop evolution as a function of the applied potential and electrolyte concentration.
Potential of zero charge (PZC) determination and comparison between the experimental and simulated spectral full-width at half-maximum (FWHM) trends, as function of the applied potentials (E) and for an aqueous electrolyte containing 1.0 M pyrazine and a KOH concentration equal to 0.1 mM (a), 0.4 mM (b) and 1.0 mM (c), determining an EDL thickness (dEDL) of 30.4, 15.2 and 9.6 nm, respectively. The bottom part of the figure panels reports the simulated PD profiles for the different EDL thicknesses, as a function of the applied potential (LPPy, liquid phase pyrazine, LPW, liquid phase water, OCP, open circuit potential, CV, cyclic voltammetry, EC, electrochemistry, GC, Gouy–Chapman model, GCS: Gouy–Chapman–Stern model, and APXPS, ambient pressure X-ray photoelectron spectroscopy). The error bars were determined via repeated measurements of the FWHM of a given core level, propagated with the experimental spectral resolution (see Methods section).

