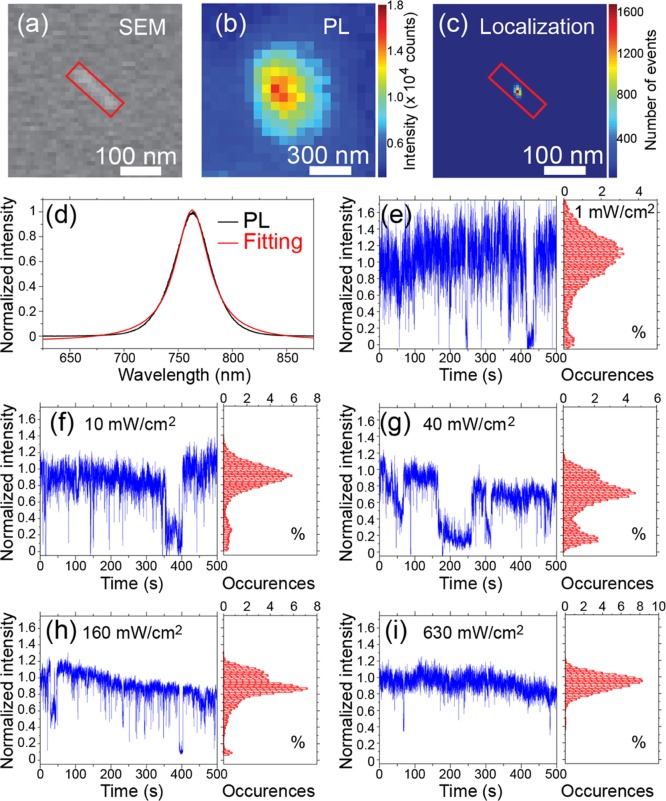
Figure 2.
(a) Scanning electron micrograph of an individual perovskite nanorod, 140 nm in length and 40 nm in width. (b) PL image of the same perovskite nanorod. (c) Plot of the localization events by applying 2D Gaussian fitting. (d) PL spectrum of the same perovskite nanorod. The red curve is a Lorentzian fitting. (e–i) PL time traces (normalized intensities) and the corresponding intensity histograms (in percentage) of the same perovskite nanorod under different excitation power densities, that is, 1, 10, 40, 160, and 630 mW/cm2.

