Figure 3.
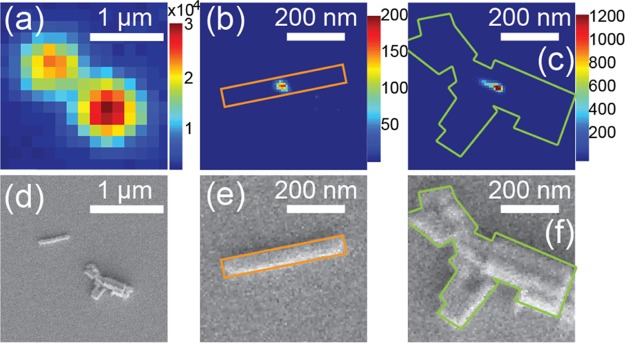
(a) PL image of two bright spots. The spot on the left side is because of the PL emission from an individual perovskite nanorod. The spot on the right side comes from a random cluster of several perovskite nanorods. The corresponding scanning electron micrograph on the same sample area is given in (d). The color bar shows the PL intensity in the unit of counts per frame (50 ms). The excitation power density was 16 mW/cm2. (b and c) Plots of super-resolution localization events over the two bright spots in (a). The color bars represent the numbers of localization events. (e and f) scanning electron micrographs of the two nanostructures that correspond to (b) and (c), respectively. Solid lines in orange and in green colors outline the two nanostructures, respectively.

