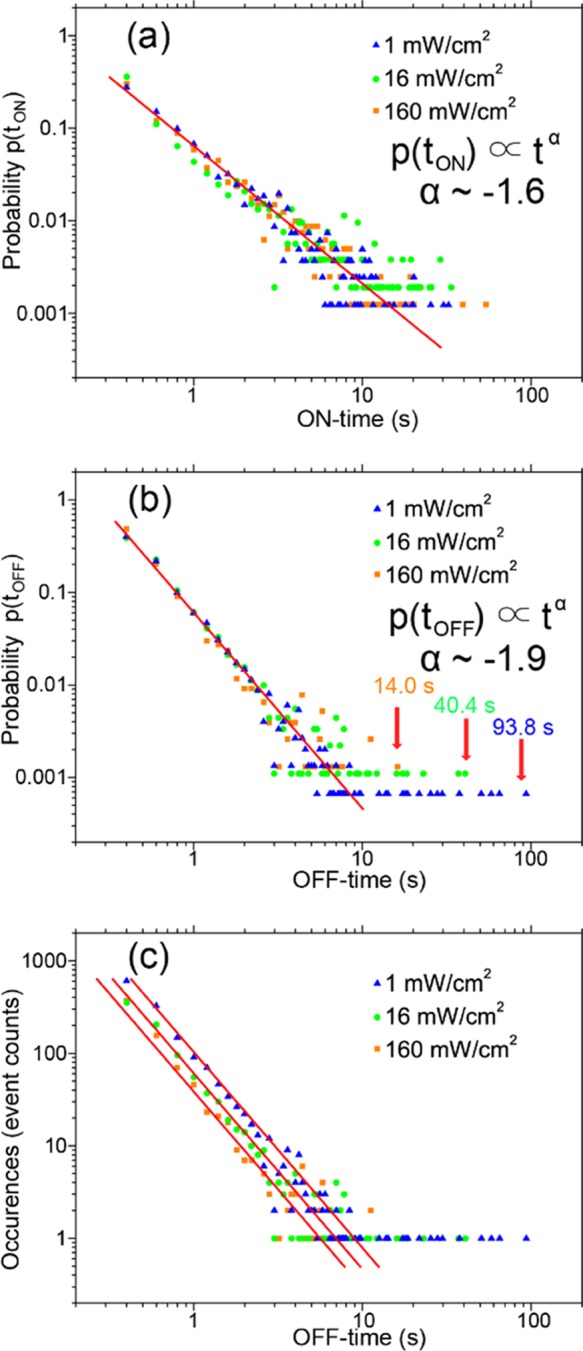
Figure 4.

(a) Probability distributions of ON times under different laser excitation power densities. The red solid line shows a power-law profile with the power parameter α = −1.6. (b) Probability distributions of OFF times under different laser excitation power densities. The red solid line shows a power-law profile with the power parameter α = −1.9. (c) The OFF-time PL blinking histogram of 14 individual perovskite nanorods resembles the power law. Different excitation power densities were examined, that is, 1 mW/cm2 (blue triangles), 16 mW/cm2 (green dots), and 160 mW/cm2 (orange squares).
