Figure 5.

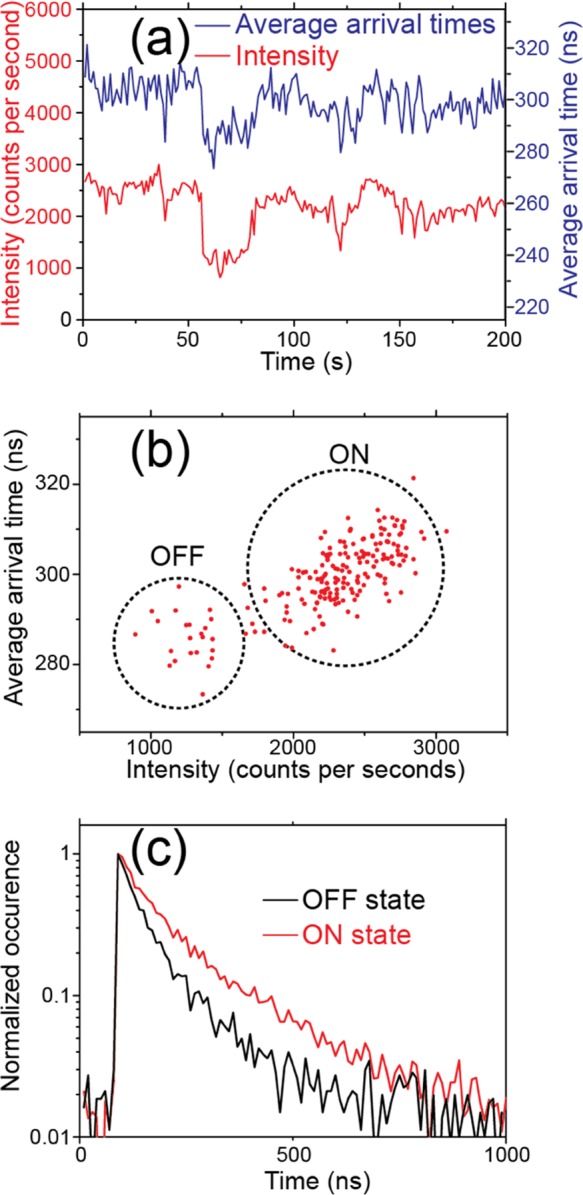
(a) Time traces of PL intensity (red) and average arrival times measured on an individual OHP nanorod. (b) Correlation scattered plot of average arrival times versus PL intensities. Dashed cycles are used to highlight the ON and OFF states. (c) PL decay time histograms of ON and OFF states.
