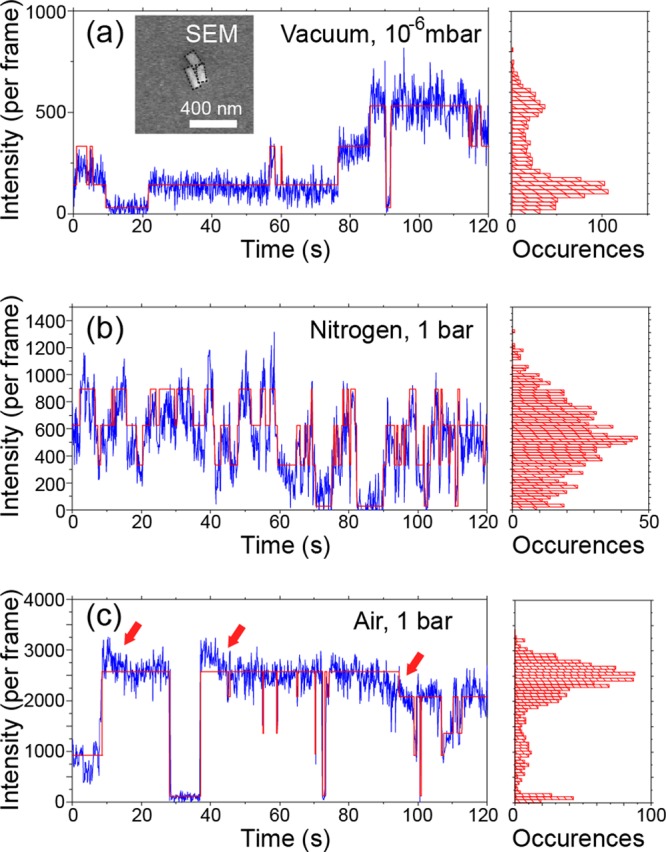
Figure 6.

PL blinking time traces and histograms of perovskite nanorods under different environments, that is, under vacuum (a), in nitrogen under the ambient pressure (b), and in air under the ambient pressure (c). The same excitation power density of 16 mW/cm2 was applied. The inset shows the scanning electron micrograph of the cluster of three perovskite nanorods. The red lines are guide for the eye, generated using vbFRET package.64
