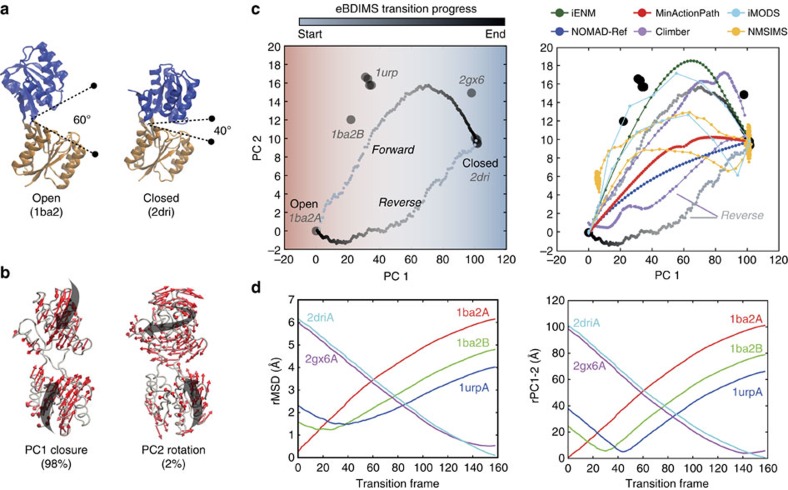
Figure 2. Conformational transition of E. coli ribose-binding protein (RBP).
(a) Crystallographic unbound (1ba2) and ribose-bound (2dri) state of RBP; the two ligand-binding domains are coloured in blue and orange. (b) Principal components of the X-ray ensemble (11 structures) track domain closing and subtle rotation versus the reference 1ba2. (c) Left: projection of the ensemble structures and the eBDIMS trajectories onto the PC1-2 subspace; note how PC1 separates the crystal structures into three–four clusters (shown as red (unbound), white (intermediates) and blue (bound) regions). Right: comparison between the forward pathways computed by eBDIMS, iENM, NOMAD-Ref, MinActionPath and Climber. Reverse pathways generated by eBDIMS, iMODS, NMSIM and Climber also shown. (d) rMSD and PC1-2 distance between the forward trajectory and the sequence of crystallographic intermediates.

