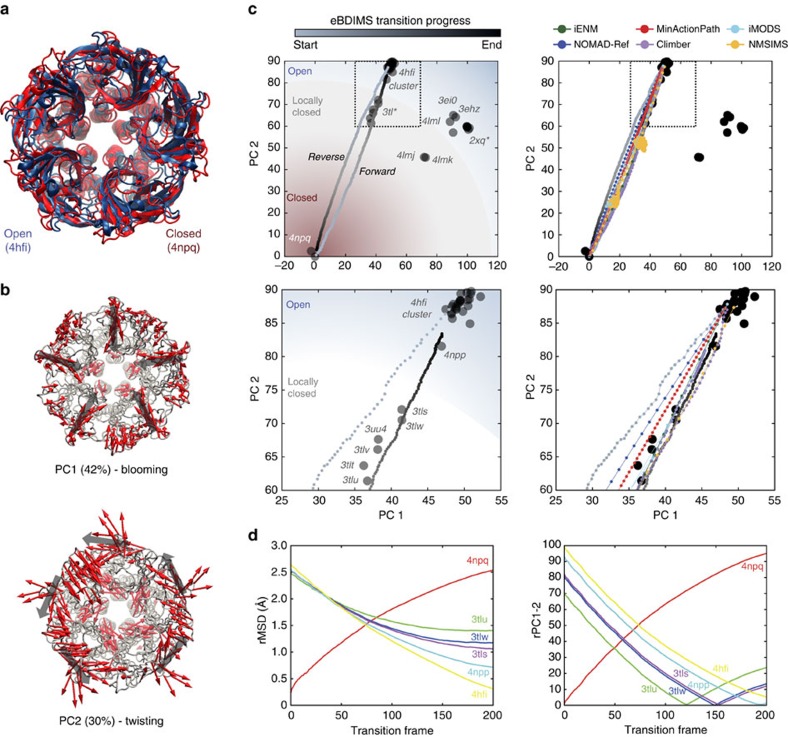
Figure 7. Conformational transition of GLIC.
(a) The two crystallographic structures representing the resting state (4npq) and the open conducting state (4 hfi). (b) Dominant PCs of the GLIC X-ray ensemble (46 structures) versus 4npq. (c) Projection of the eBDIMS pathway onto the two major PCs of the ensemble (left); zoom highlighting the distribution of structures in the locally closed region (right). (d) Comparison between the forward pathways computed by eBDIMS, iENM, NOMAD-Ref, MinActionPath and Climber. Reverse pathways generated by eBDIMS, iMODS, NMSIM and Climber also shown.

