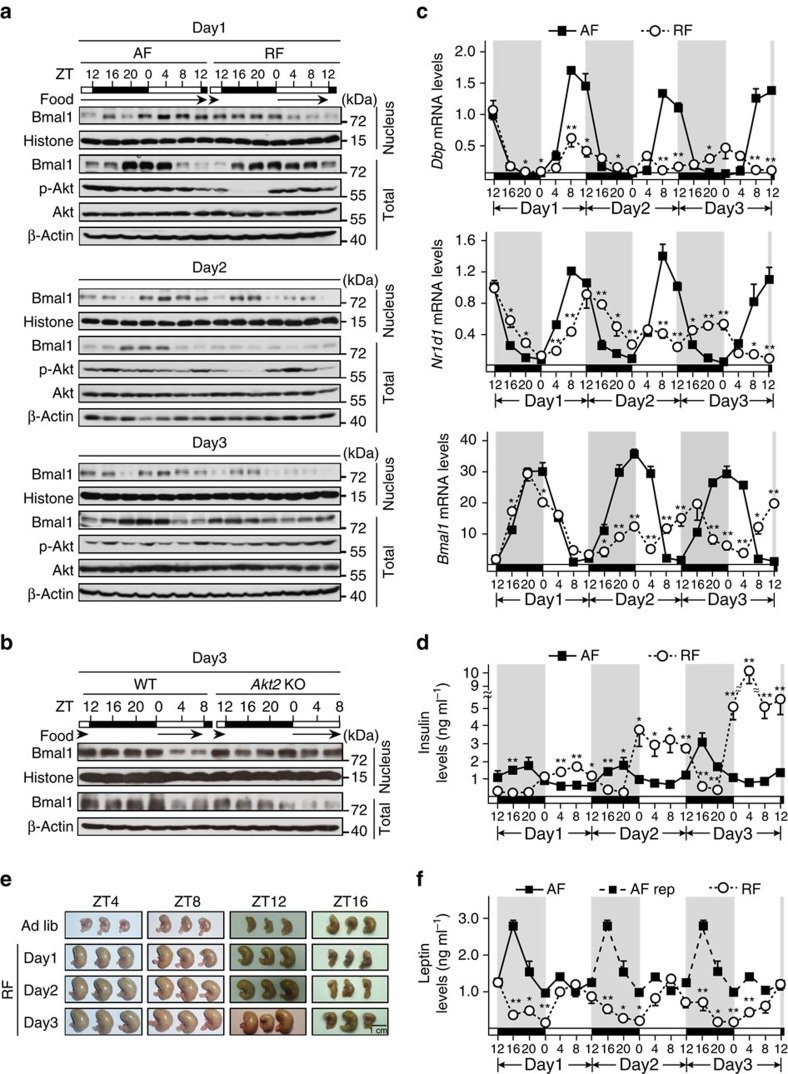
Figure 5. Temporal interplay between Bmal1 and insulin rhythms.
Mice were killed every 4 h over the first 72 h under either AF or RF initiated at Day1-ZT12, black arrows indicated food availability; plasma, total RNA, pooled liver total and nuclear protein extracts were prepared (a,c,d–f; n=3). (a) Immunoblotting analysis of pooled nuclear and total Bmal1 protein levels. (b) Immunoblotting analysis of pooled nuclear and total Bmal1 protein levels in livers from WT or Akt2 KO mice under RF during Day3 (n=3). (c) Quantitative PCR analysis of Dbp, Nr1d1 and Bmal1 mRNA levels. (d) Measurement of plasma insulin levels by ELISA. (e) Pictures of mouse stomachs from AF and RF mice as indicated. (f) Measurement of plasma leptin levels. Leptin levels presented in Day2 and 3 were replicated from those of Day1 (AF rep, black squares and dash lines). Data are represented as mean ±s.e.m, statistical analyses were performed with a two-tailed unpaired Student's t-test, *P<0.05, **P<0.01 between groups at each time point.

