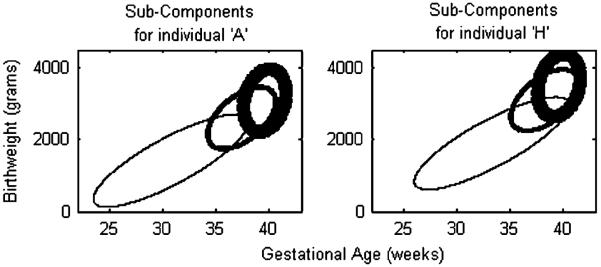
Figure 3.
A posterior point estimate of the component configuration for individual A. The ellipses correspond to contours containing ≈86.5 per cent of mass associated with the component. The thickness conveys the relative proportions in the mixture distribution (see Table V).

