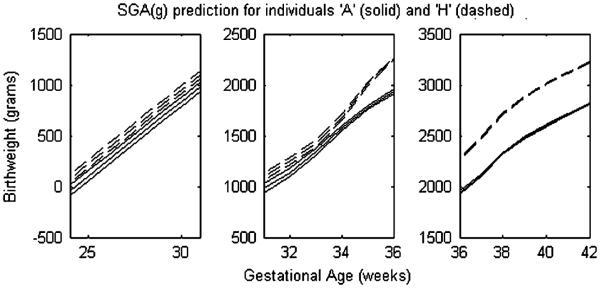
Figure 4.
Conditional predictions of the small for gestational age cutpoint SGA(g) (the 10th percentile cutpoint of birthweight at gestational age g) for individuals A and H. The single gestational age axis is separated into three plots so that the 95 per cent credible intervals may be examined. The predictions were generated from the conditional distributions implied by the joint distributions represented in Figure 3. Table IX provides the related results for other individuals.

