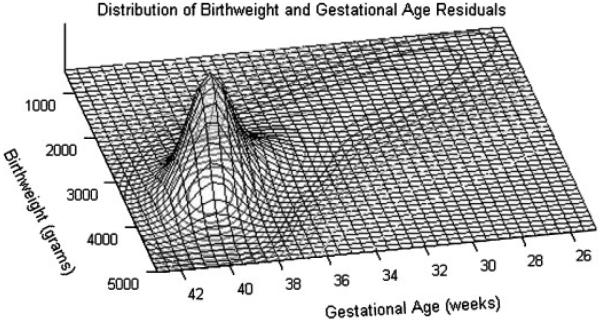
Figure 5.
Point estimate of the surface of the mixture distribution for birthweight and gestational age for the referent individual H. The orientation of this plot is a nonstandard ≈180° rotational form. As a result, birthweight increases from top to bottom and gestational age decreases from left to right. Posterior 95 per cent credible intervals of the surface tightly fit this curve, and so were not included in this image.

