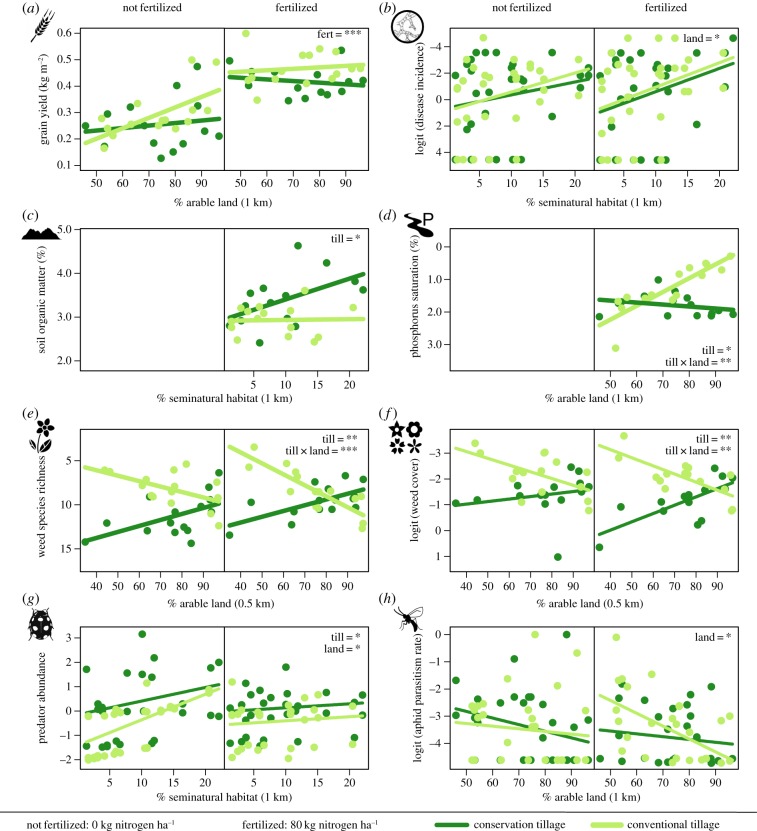
Figure 1.
Relationships between ecosystem services and landscape variables for different fertilization treatments (left panels, 0 kg N ha−1; right panels, 80 kg N ha−1) and under different tillage systems (dark green, conservation tillage; light green, conventional tillage). Significant explanatory variables and/or interactions are displayed in bold. p-Values are from linear mixed-effects models (*p < 0.05; **p < 0.01; ***p < 0.001. See table 2). Y-axes are reversed for disease incidence, phosphorus saturation, weed species richness and cover (b,d,e,f) so that values higher on the axis represent higher levels of ecosystem service provision. Points correspond to partial residuals. (Online version in colour.)

