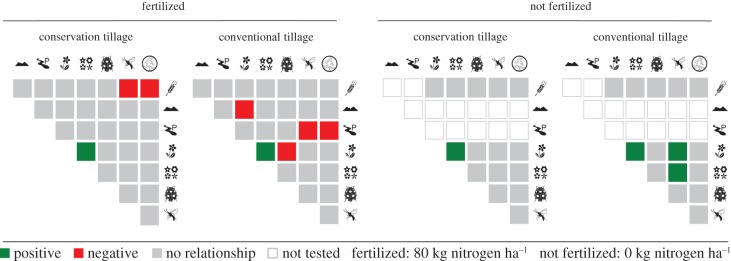
Figure 2.
Pairwise relationships between ecosystem services for different fertilization treatments (fertilized: 80 kg N ha−1; not fertilized: 0 kg N ha−1) and under different tillage systems calculated through Spearman's rank correlations. Green are positive and red are negative relationships between ecosystem services (correlation values different, greater or lower than zero, Spearman's rank p < 0.05. See electronic supplementary material, figure S2). Grey reflects no correlation whereas empty squares correspond to non-tested relationships (soil organic matter and phosphorus saturation were not measured in non-fertilized plots). Each indicator was transformed so that higher values corresponded to higher values of service provision. The eight ecosystem service indicators are labelled by their respective symbols. (Online version in colour.)

