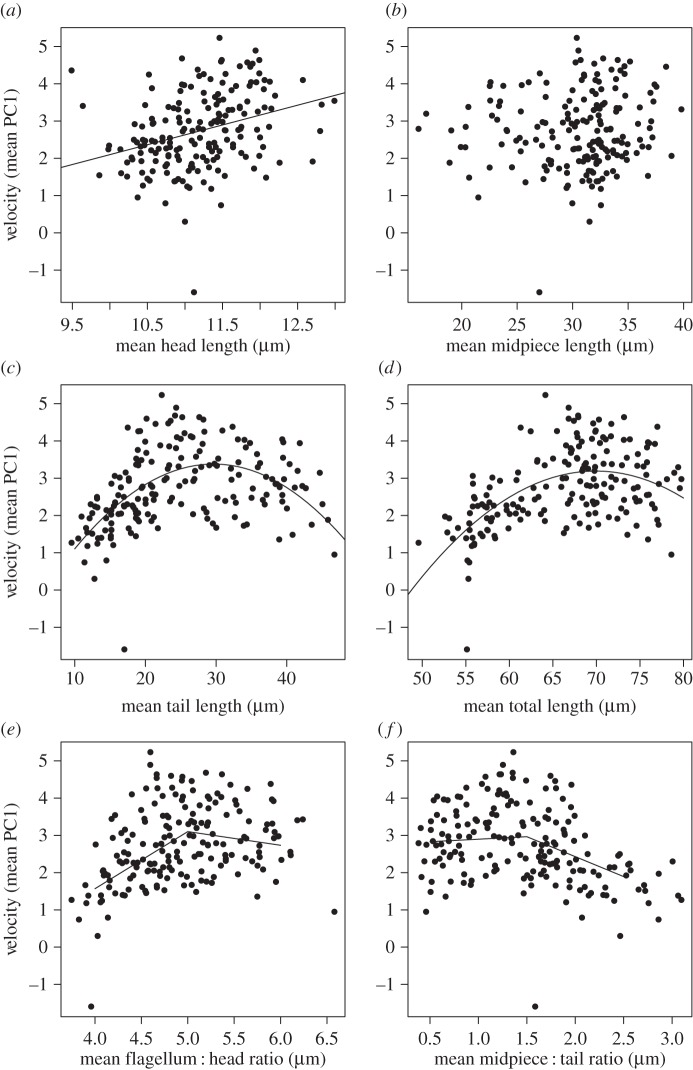
Figure 2.
The relationship between swimming velocity (PC1) and (a) head, (b) midpiece, (c) tail, (d) total, (e) flagellum : head, and (f) midpiece : tail of the fastest 10% of sperm per male (n = 183). Only midpiece length was unrelated to swimming velocity (PC1). Each data point is the mean score of sperm morphology for a single male. The solid black line shows the predicted relationship from the linear models. See the electronic supplementary material for the model output.

