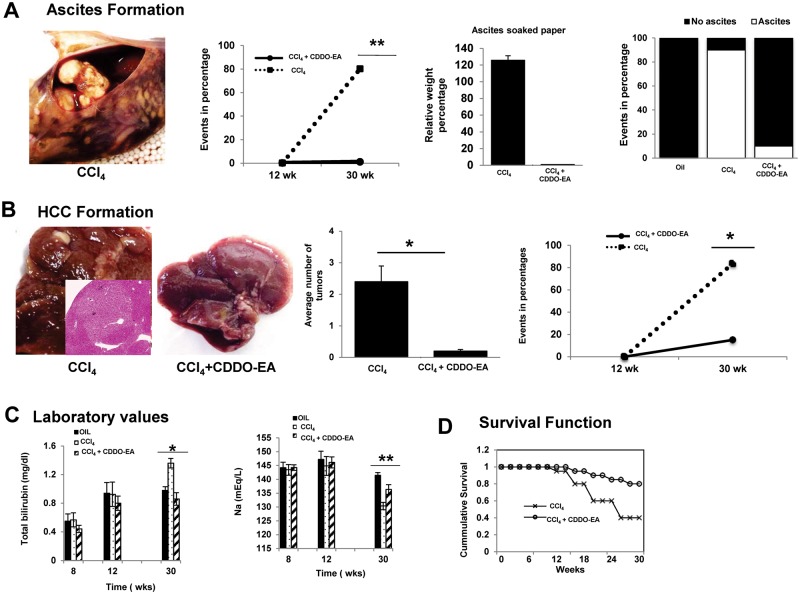
FIG. 2.
CDDO-EA treatment reduces complication of end stage liver disease and improves mortality. A, Representative ascites photograph at week 30 in CCl4 treated group. Longitudinal graph shows percentage of ascites formation. Histogram shows relative weight of soaked ascites paper (middle panel) whereas right panel depicts event noted per group for the formation of ascites. B. Representative photograph of gross livers from mice at week 30 post treatment of CCl4 plus CDDO-EA. Histogram depicts average number of tumors identified per group. Data are presented as mean ± SE (n = 10 per group). Longitudinal graph shows percentage of HCC formation after CCl4 treatment for 12 weeks followed by 18 more weeks of CDDO-EA. C. Liver function test over time in CDDO-EA treated versus nontreated. Data represent mean ± SE (n = 20 per time point). D, CCl4 treated mice had > 70% mortality after 30 weeks while addition of CDDO-EA at week 12 had < 20% mortality during the same period of time. (N = 40 per group). *P < .05, **P < .01, ***P < .001.

