Figure 3.
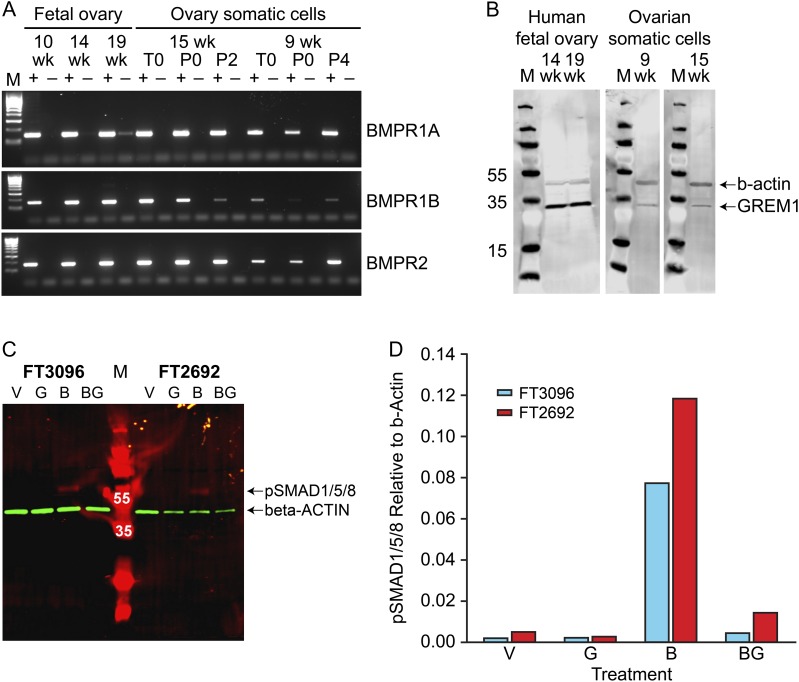
Components of the BMP signalling pathway are expressed in human fetal ovary and cultured ovarian somatic cells and regulate SMAD1/5/8 phosphorylation. A: Agarose gel analysis of RT-PCR products for the 3 BMP receptors (BMPR1A, BMPR1B, BMPR2). M is the 100 bp Hyperladder (Bioline). (+) and (−) represent reactions with RT(+) and RT(−) cDNAs respectively. Gestations of fetal ovaries and derived somatic cell cultures used are given in weeks (wk). T0 is cells from ovary disaggregation prior to plating (i.e. contains both germ and somatic cells), P0 is adherent somatic cells taken just prior to the first passage and P2-4 represents the number of passages undergone for each cell culture. B: Western blot analysis of GREM1 expression. M is the PageRuler Plus (10–250 kda) Prestained Protein Ladder (Fisher Scientific) and numbers beside individual marker bands give their MW as a guide. GREM1 (lower bands) with β-actin (upper bands) acting as a positive control. C: Western blot of protein extracts from cells (cultures FT3096 and FT2692) treated with vehicle (V), recombinant GREM1 (G), recombinant BMP4 (B) or BMP4 + GREM1 (BG) for 1 hour after overnight serum-starvation. M is the PageRuler Plus (10–250 kda) Prestained Protein Ladder (Fisher Scientific) and white numbers over individual bands indicate their MW. pSMAD1/5/8 signal (expected MW = 60) is red while the β-actin normalisation control (expected MW = 42) signal is green. D: Comparison of pSMAD1/5/8 levels normalised to β-actin signal for each treatment and cell culture (single replicates only performed).

