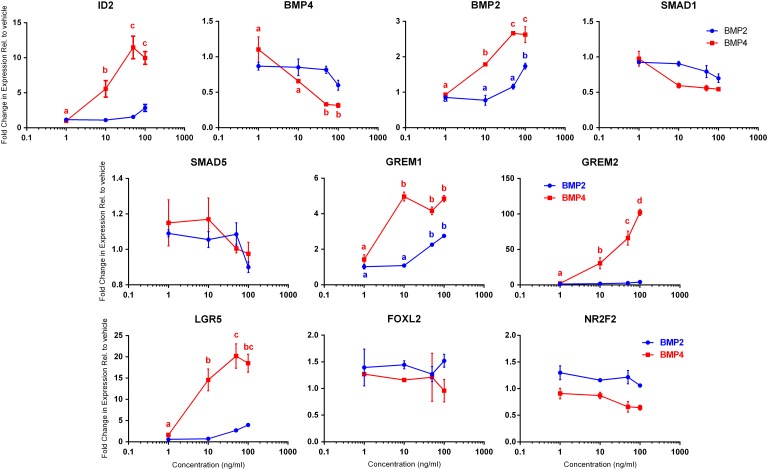
Figure 4.
Titration of BMP4 and BMP2 effects on downstream gene expression in human fetal ovarian somatic cells. FT2692 ovarian somatic cells were serum-starved overnight and then treated (2 replicate wells per treatment) with vehicle or 1, 10, 50 or 100 ng/ml of recombinant human BMP4 or BMP2 for 24 h and RNA extracted. QRT-PCR for the genes indicated was performed and normalised to levels of RPL32 before calculating fold changes relative to the vehicle control. Data points are mean ± sem. BMP2 treatment graphs are blue while BMP treatment graphs are red. Data were analysed by ANOVA with Tukey's multiple comparisons post-hoc tests and significant differences (P ≤ 0.05) between treatment concentrations are indicated by different letters (with colour matching key) above the relevant concentration.

