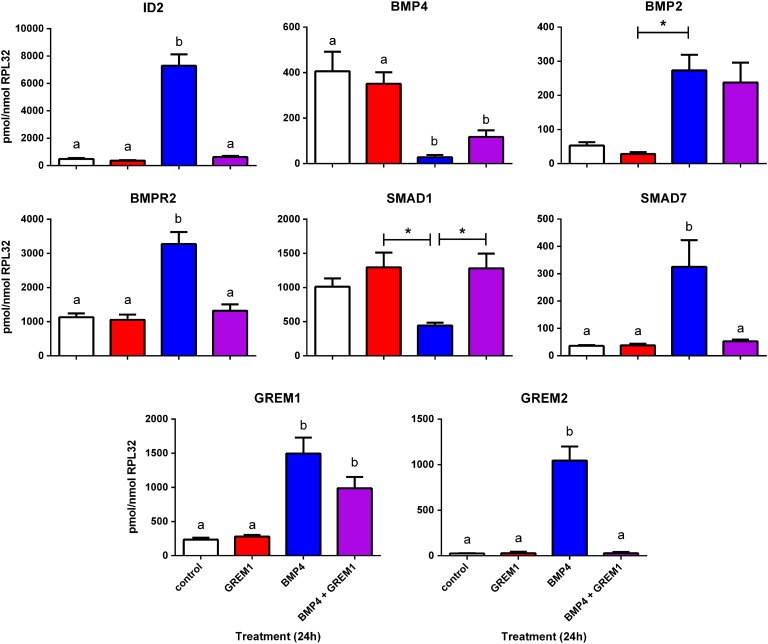
Figure 5.
GREM1 sensitivity of BMP4 target genes in human fetal ovarian somatic cells. FT3010 cells were serum-starved overnight and treated with ± 1 µg/ml GREM1, ± 50ng/ml BMP4 (n = 4 replicate wells for each treatment) for 24 hours before RNA extraction and qRT-PCR analysis of key BMP4 targets, with normalisation to RPL32 transcript levels. Columns represent mean ± sem for each treatment (white = vehicle, red = GREM1, blue = BMP4, purple = BMP4 + GREM1). Differences in expression levels between treatments were analysed by ANOVA with Tukey's multiple comparisons post-hoc tests and significant differences (P ≤ 0.05 or less, as indicated in the main text) between treatments are indicated by different letters above the columns, or * in the case of SMAD1 (P = 0.01).

