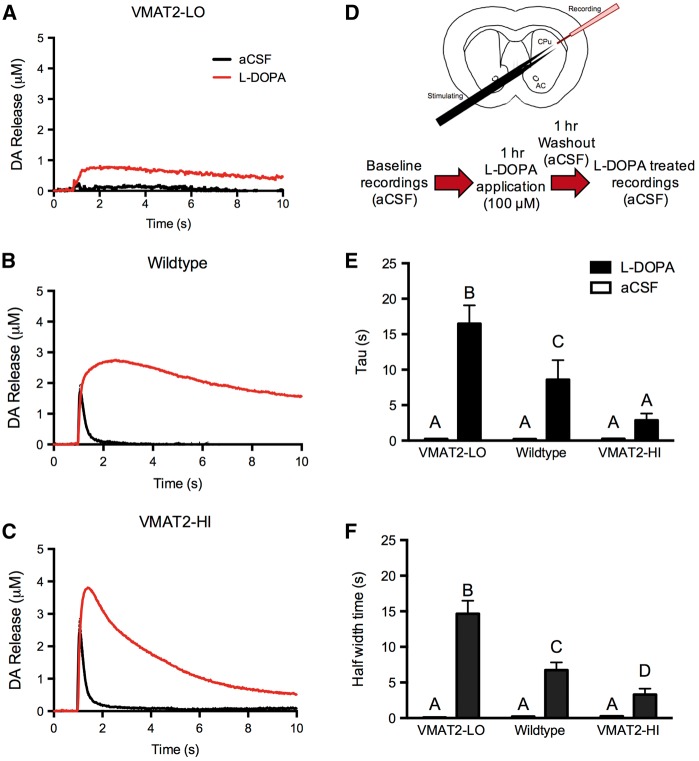
FIG. 3.
VMAT2 level modifies stimulated dopamine (1p) release and dopamine clearance following L-DOPA application. A–C, At baseline, VMAT2-LO mice show the smallest dopamine release (n = 3), and VMAT2-HI mice show the largest release (n = 6), compared with wild-type mice (n = 6). Following L-DOPA application (D), all 3 genotypes showed increases in DAmax compared with baseline values, however the fall time of the release traces appeared to be particularly affected between the genotypes. E and F, VMAT2-HI mice show a significant decrease in both the rate constant, tau, and half-width, all of which reflects the steeper fall of the release traces in this genotype compared with wild-type and VMAT2-LO mice. Different letters above the bars indicate differences of at least P < .05 as indicated by a 2-way ANOVA and Bonferroni post hoc tests.

