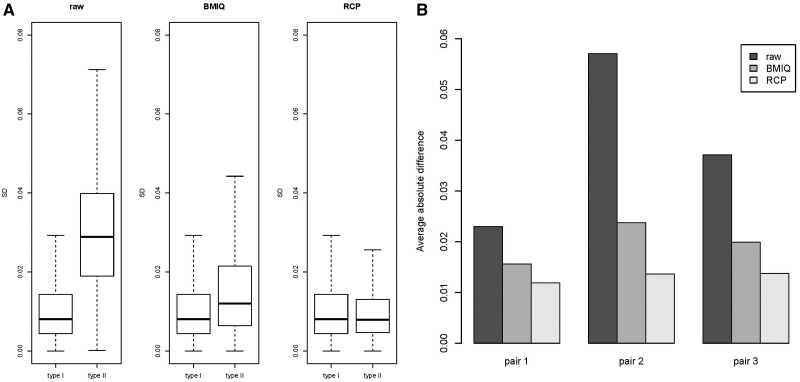
Fig. 2.
(A) Boxplots of the standard deviations of beta values across the three HCT116 WT replicates considered in Dedeurwaerder et al. (2011), for raw beta values (raw), adjusted beta values by BMIQ (BMIQ) and adjusted beta values by RCP (RCP). (B) Bar plots of the averaged (across type II probes) absolute difference of beta values between two replicates in each of three possible pairs of the three replicates, for raw beta values (raw), adjusted beta values by BMIQ (BMIQ) and adjusted beta values by RCP (RCP)

