
Fig. 3.
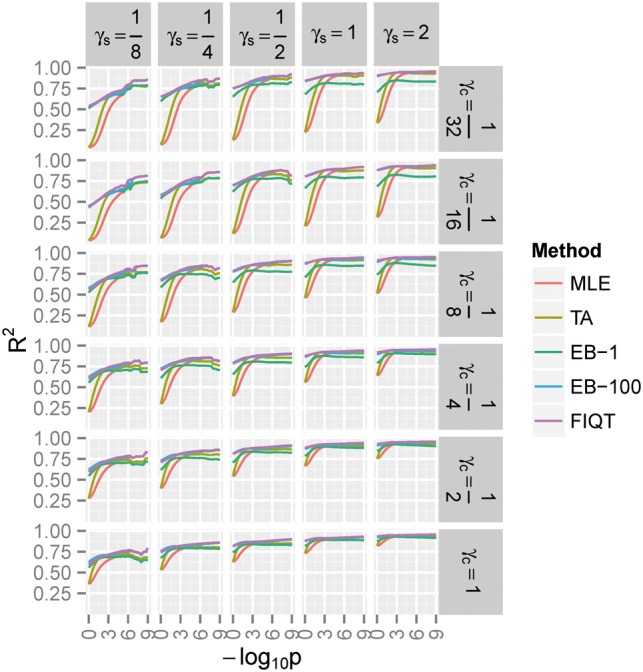
The alternative hypothesis variability (R2) in Z-score noncentrality for SNPs having negative log (unadjusted) P-values below -log10 P. See Figures 1 and 2 for background and notations
Official websites use .gov
A
.gov website belongs to an official
government organization in the United States.
Secure .gov websites use HTTPS
A lock (
) or https:// means you've safely
connected to the .gov website. Share sensitive
information only on official, secure websites.
The alternative hypothesis variability (R2) in Z-score noncentrality for SNPs having negative log (unadjusted) P-values below -log10 P. See Figures 1 and 2 for background and notations