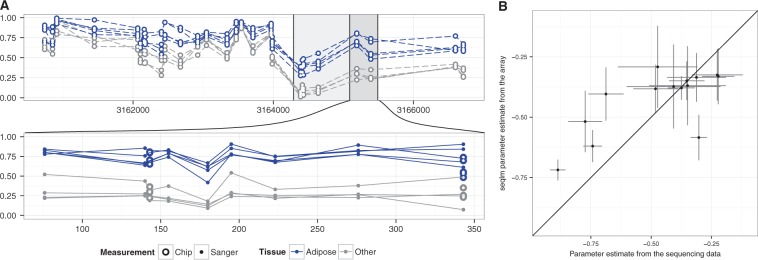
Fig. 2.
Validation of identified DMR-s. Panel A has an example from the tissue dataset together with a DMR detected by seqlm (large grey box). The top plot shows the data on array resolution and in bottom plot a portion of the DMR has been zoomed in, and methylation levels of intermediate CpG sites obtained by Sanger sequencing are shown. Panel B shows the effect sizes that are estimated from array data and from Sanger sequencing data for all 14 regions. The 95% confidence intervals are shown for both sources of estimates (Color version of this figure is available at Bioinformatics online.)

