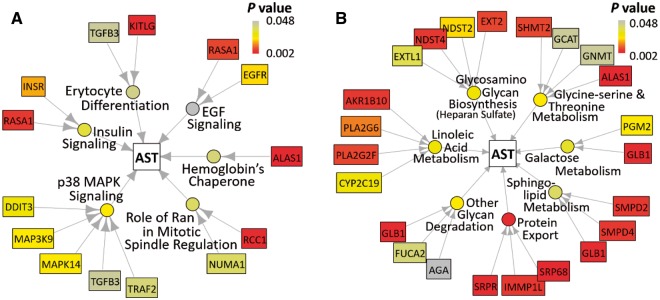
Fig. 4.
Visualizations generated by PHARAOH in the discovery study of AST levels. Outermost rectangles indicate statistically significant genes within significant pathways, circles represent statistically significant pathways, and center square indicate the phenotype of interest. (A) Result using the Biocarta pathway database and (B) result using the KEGG database

