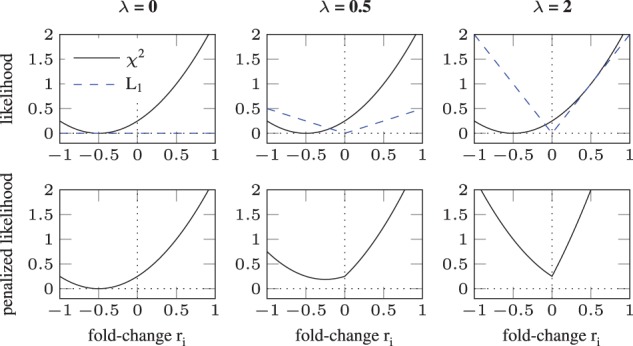
Fig. 2.

Sparsity and bias introduced by L1 regularization. Regularization weight λ is increased from panels left to right. In the upper row, the contributions from the data (—black line) and a L1 regularization term (dashed blue line) are shown. Their sum is plotted in the lower row. For , a bias is introduced shifting the minimum towards zero (middle column). When λ is increased to 2, the minimum is exactly at zero, i.e. sparsity is induced (right column)
