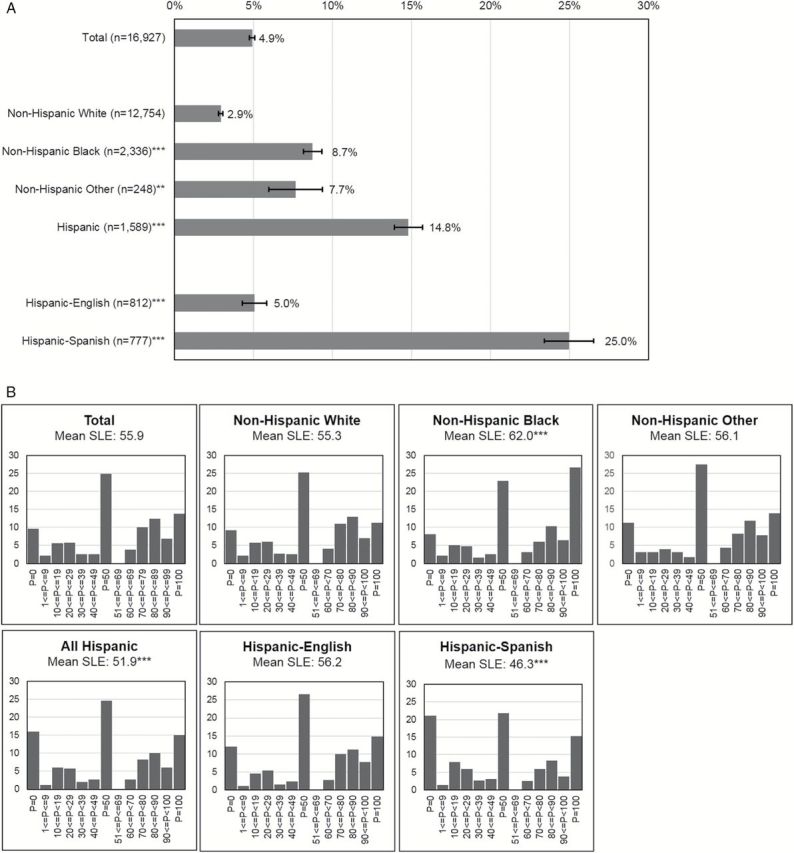
Figure 2.

Response patterns to subjective life expectancy by race, ethnicity, and interview language, unweighted, adults aged 50–89 years, Health and Retirement Study 2004. (A) Item nonresponse to subjective life expectancy and the 95% confidence interval. Item nonresponse rate is significantly different from non-Hispanic Whites’ at **p < .01 and ***p < .001. (B) Distribution of subjective life expectancy responses. The mean of SLE is significantly different from non-Hispanic Whites’ at ***p < .001
