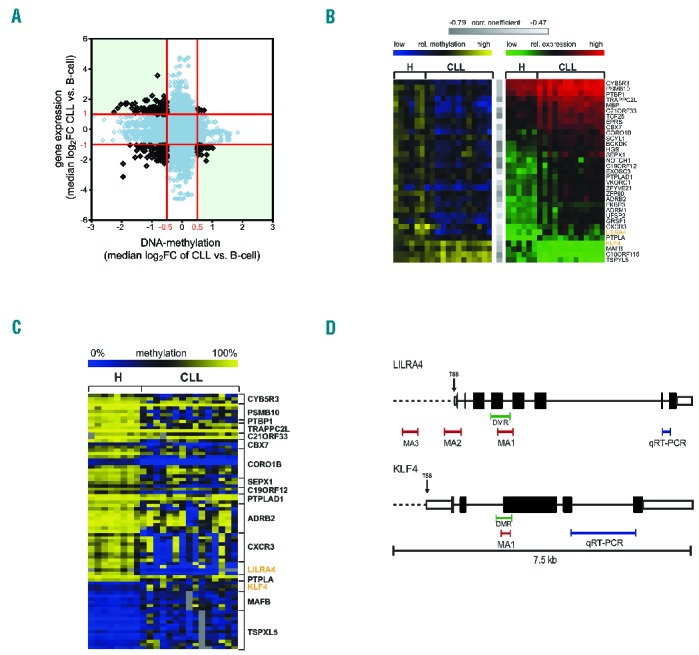
Figure 1.

A subset of genes is deregulated by promoter DNA-methylation in chronic lymphocytic leukemia (CLL). (A) Analysis of gene expression and DNA-methylation profiling (MCIp-array) of CD19+ B cells of 9 healthy donors (H) and 15 CLL patient samples. Overall correlation between promoter DNA-methylation and gene expression is depicted. Median log2FC values of CLL versus H for all differentially methylated 500 bp windows (P≤0.05) and the respective differential expression oligonucleotides (P≤0.05) are shown. Red lines indicate cut offs for expression and methylation for further analysis which were |log2FC| > 1 and >0.5, respectively. Genes of interest were identified from top left quadrant (low DNA-methylation and high expression) and bottom right quadrant (high DNA-methylation and low expression). (B) Correlation between DNA methylation and respective gene expression identified 33 genes as potentially deregulated by DNA-methylation. Heatmap in yellow and blue shows DNA-methylation values as log2FC of all samples present on both, expression- and MCIp arrays (H n=6, CLL n=13). Blue indicates low relative methylation, yellow high methylation. Heatmap in green and red displays expression values for same patients with green indicating low and red high expression of the listed genes. All genes showed significant negative correlation (Pearson correlation) between DNA-methylation and gene expression with correlation coefficient −0.79 ≤ r ≤ −0.47 (indicated by gray bars) and P≤0.21. (C) DNA-methylation analysis was performed with MassARRAY in addition to MCIp in 33 candidate genes to identify genes where both complementary methods show aberrant DNA-methylation. Seventeen of these genes showed aberrant DNA-methylation in at least one CpG unit (CGU; shown in rows) in the promoter (Mann-Whitney U test P≤0.05). Absolute methylation values ranging from 0% to 100% of significantly aberrant CpG units are illustrated in the heat map. Blue color indicates low, yellow high DNA-methylation levels. Positions of MassARRAY amplicons (MA) are indicated in (D). (D) Scheme illustrating the positions of all MassARRAY (MA; red bars) and qRT-PCR (blue bars) amplicons measured for LILRA4 (upper panel) and KLF4 (lower panel). Differentially methylated regions (DMR), identified in the MCIp-array analysis, are marked with green bars. For KLF4 and LILRA4, one amplicon each (MA1) was selected that covers the respective DMR. Two additional amplicons MA2 and MA3 were selected for LILRA4 to represent DMRs previously identified.3 Exons are represented by black boxes, untranslated regions (UTR) by white boxes and the transcription start sites (TSS) are indicated by an arrow.
