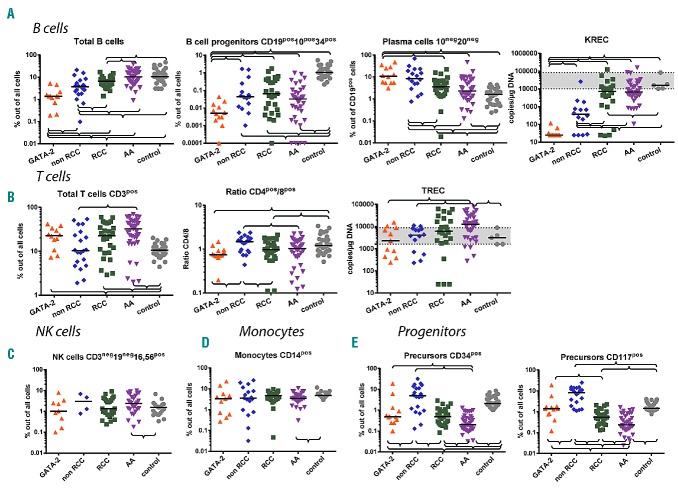
Figure 1.
Cell populations in bone marrow (BM). (A) B-cell subpopulations and kappa-deleting recombination excision circles (KRECs). (B) T-cell subpopulations and T-cell receptor excision circles (TRECs). (C) Natural killer cells. (D) Monocytes. (E) Progenitors. Braces indicate significant difference between the parameters using the non-parametric Mann-Whitney test (P<0.05). Black lines represent medians. A gray area indicates the range of control samples.

