
Figure 1.
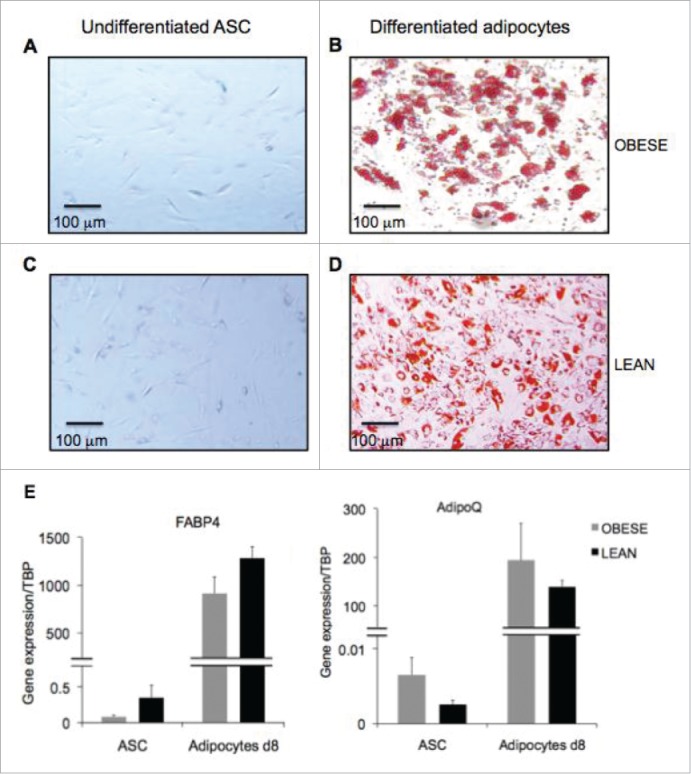
Generation of differentiated adipocytes from ASC derived from subcutaneous AT of obese donors. Oil Red O staining of undifferentiated ASC (A,C) and differentiated adipocytes (B,D) respectively at day 8 and 14 of differentiation. Scale bars represent 100 µm. (E) Gene expression quantification of adipogenic genes FABP4 (left graph) and AdipoQ (right graph) in ASC and ASC-derived adipocytes at 8d of differentiation derived from obese (gray bars) and lean (black bars) donors. Error bars represent standard deviations from n ≥ 3 independent experiments.