
Figure 3.
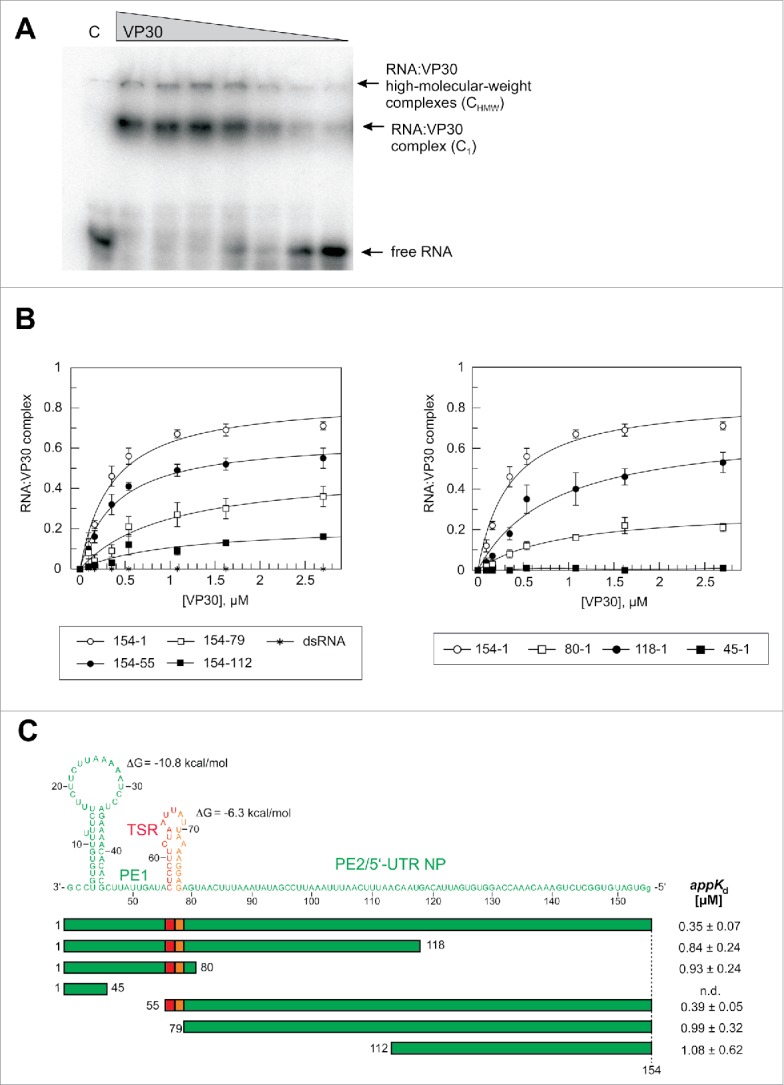
Effects of truncations of the genomic RNA 154–1 on VP30 binding. (A) Representative EMSA experiment for the genomic leader RNA 154–1. Two different RNA:VP30 complexes (C1 and CHMW; for details, see Materials and Methods) could be observed in addition to the free RNA. VP30 concentrations were from right to left: 0.1, 0.2, 0.4, 0.5, 1.1, 1.6 and 2.7 µM; C, 4 µM MBP only. (B) RNA binding curves of VP30 using the different derivatives of RNA 154–1 with deletions from the 3′- (left panel) or 5′-end (right panel). The left panel includes the dsRNA substrate (RNA 154–1 preannealed to its complementary strand 2–158). Each curve is based on at least 3 independent experiments (error bars are standard deviations of the mean); curves were fitted according to a one-ligand-binding-site model. (C) Correlation of RNA sequence and secondary structure (derived from the probing experiments in Fig. 2) with the RNA truncations; the ΔG values of the stem-loops are the minimum free energies of the centroid secondary structures predicted by RNAfold for the sequences of the hairpin structures plus 1 extra nt on each side using the default parameters (http://rna.tbi.univie.ac.at/cgi-bin/RNAfold.cgi). The sequence stretch responsible for transcription initiation by the viral polymerase (TSR) is colored in red, the spacer (5′-half of the hairpin) is marked in orange and the replication promoter elements 1 (PE1, nt 55–1) and 2 (PE2, nt 154–79) are shown in green (see also Fig. 1A); the 5′-terminal G residue, which is not encoded in the viral genome, was added for the purpose of efficient T7 transcription. appKd values (± SD) are based on the graphs shown in panel B (obtained by fitting to a one-ligand-binding-site model); n.d., appKd value not determinable owing to very low binding.