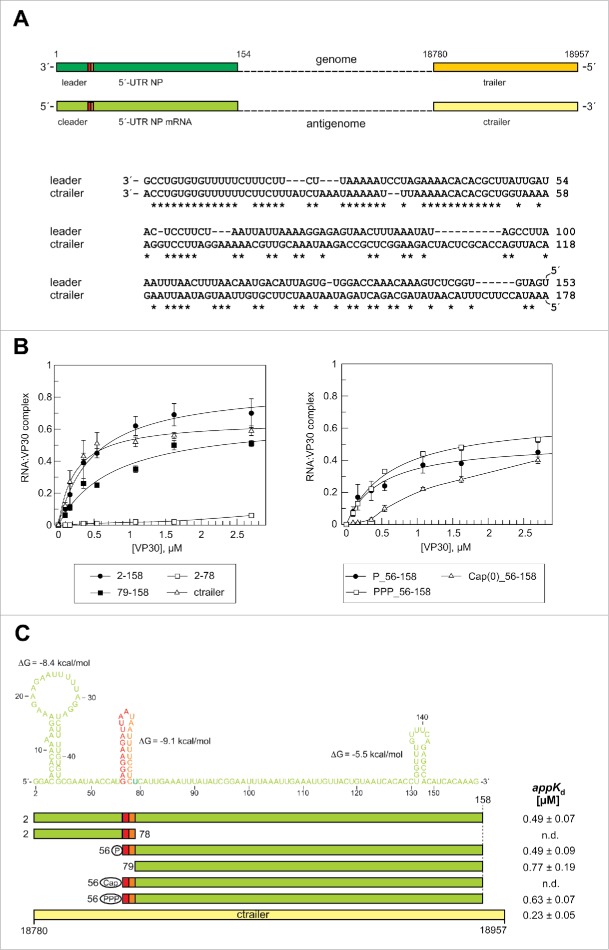
Figure 4.
Effects of truncations of the antigenomic RNA 2–158 on VP30 binding. (A) Top: Schematic comparison of the end regions in the (−) RNA genome and (+) RNA antigenome. Bottom: sequence similarity between replication promoter sequences in the genomic leader and the antigenomic trailer (ctrailer) regions. Sequence similarity is most pronounced within the first 50 nucleotides. (B) RNA binding curves of VP30 using derivatives of RNA 2–158 with deletions from the 5′- or 3′-end. We also included a ctrailer RNA (178 nt in length) substrate (see panel A) for comparison and further tested RNAs that mimic the first viral mRNA transcript (RNA 56–158) with different 5′-end groups (5′-monophosphate, 5′-triphosphate or a 5′-cap(0) moiety). Each curve is based on at least 3 independent experiments (error bars are standard deviations of the mean); curves were fitted according to a one-ligand-binding-site model. (C) Correlation of RNA sequence and secondary structure (derived from the probing experiments in Fig. S2) with the RNA truncations. The color code corresponds to that in Fig. 3. The first nucleotide complementary to the 3′-terminal residue of the genome was omitted for reasons of efficient T7 transcription. The ΔG values of the stem-loops are the minimum free energies of the centroid secondary structures predicted by RNAfold for the sequences of the hairpin structures plus 1 extra nt on each side using the default parameters (http://rna.tbi.univie.ac.at/cgi-bin/RNAfold.cgi). AppKd values (± SD) are based on the graphs shown in panel B (obtained by fitting to a one-ligand-binding-site model); n.d., appKd values not determinable owing to very low binding or abnormal curve shapes.

