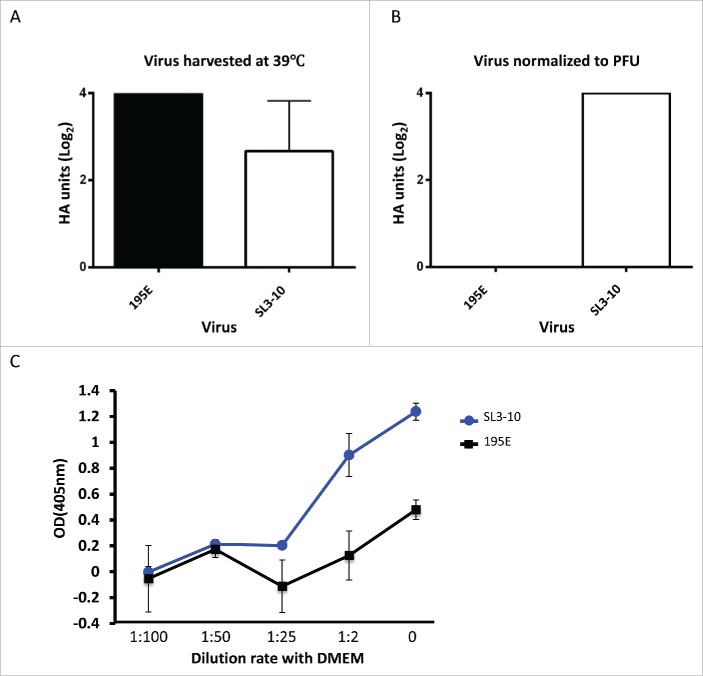
Figure 8.
Quantification of virus particles produced by infection with isolates SL3-10 and 195E. Viral particle counts assessed by hemagglutination of chicken red blood cells in supernatant harvested 9 hours post infection following MOI=1 infection of MDCK cells incubated at 39°C. (A) HA titer of unadjusted supernatants. HA titration performed in triplicate showed no variation between triplicates, data representative of 2 independent experiments. (B) HA titer normalized to the PFU of the harvested samples of SL3-10 and 195E. HA titration performed in triplicate showed no variation between triplicates, data representative of 2 independent experiments. (C) Fetuin ELISA to detect virus particles using normalized PFU samples of SL3-10 and 195E. y-axis indicates the OD values following capture of virus particles onto the ELISA plate coated with fetuin, and detection using HA antibody, and thus indicates the quantity of virus particles in each viral sample. x-axis indicates the dilution of SL3-10 and 195E viruses with DMEM.

