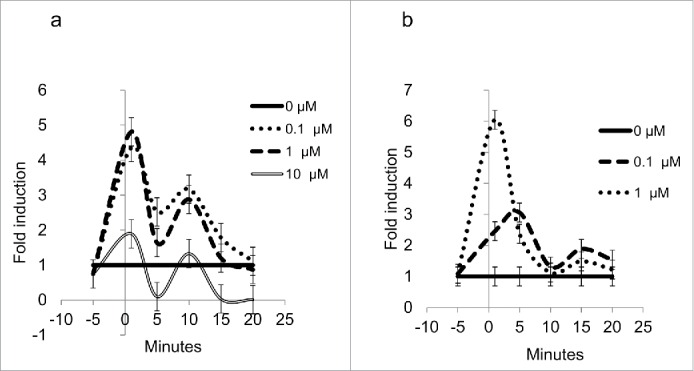
Figure 2.

(a) Expression levels for Hsd1 in 3T3-L1 adipocytes. Lines show the relative expression behavior of mRNA during the first 20 min of the experiment for treatments with 0 μM (continuous line), 0.1 μM (dotted line), 1 μM (dashed line), and 10 μM (double line) cortisone, P < 0.05. (b) Expression levels for Aqp7 in 3T3-L1 adipocytes. Lines show the relative expression behavior of mRNA during the first 20 min for treatments with 0μM (continuous line), 0.1 μM (dotted line), and 1μM (double line). Data for 10 μM are not shown. All error bars represent ± SEM, P < 0.05 (n = 3).
