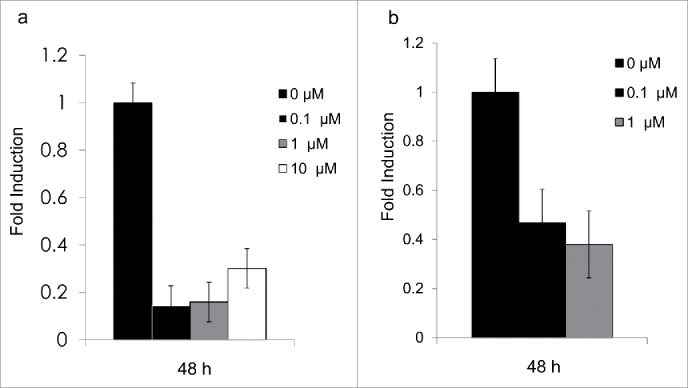
Figure 3.

(a) Expression levels for Hsd1 in 3T3-L1 adipocytes. Bars show the relative expression of mRNA after 48 h for treatments with 0 μM, 0.1 μM, 1 μM, and 10 μM cortisone, P < 0.05. (b) Expression levels for Aqp7 in 3T3-L1 adipocytes. Bars show the relative expression of mRNA after 48 h for treatments with 0μM, 0.1 μM, and 1μM cortisone. The 10 µM treatment revealed undetectable levels for theAQP7 gene, but no signs of cell-increased mortality nor detachment. All error bars represent mean ± SEM, P < 0.05 (n = 3).
