
Figure 4.
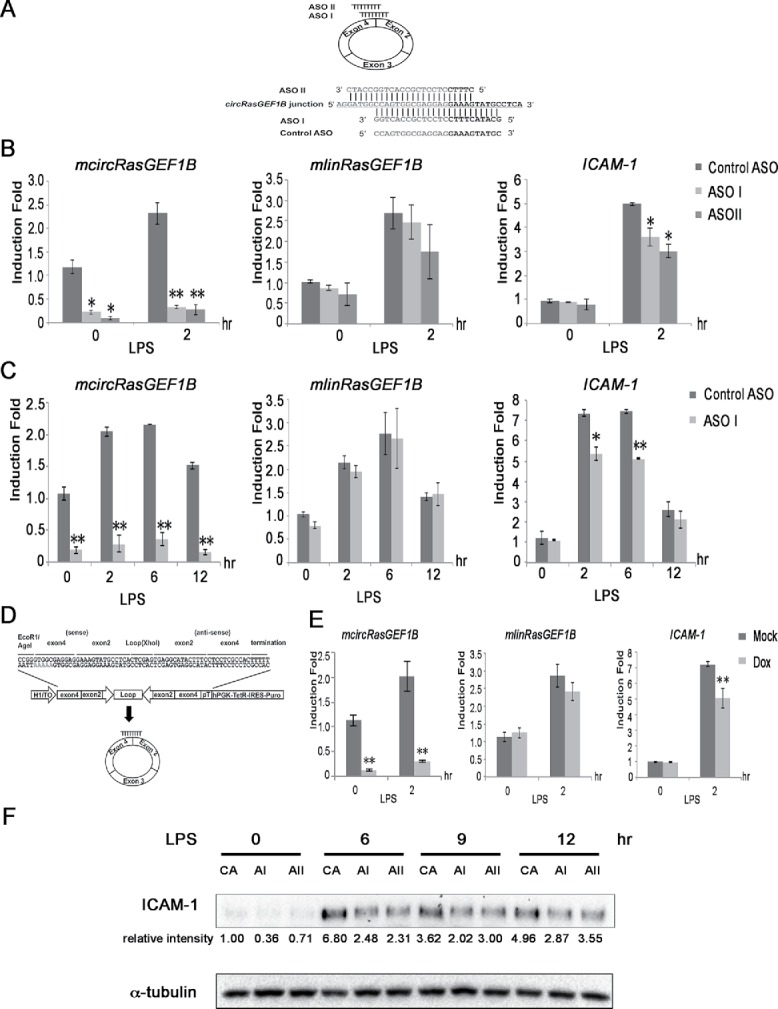
mcircRasGEF1B positively regulates the LPS-induced expression of ICAM-1. (A) ASO I and II targeting mcircRasGEF1B at the junction of exons 4 and 2. The control ASO is in the sense orientation but with the same coordinates as ASO I. (B) RAW264.7 cells were transfected with ASO I, ASO II and control ASO, and induced with LPS for 2 hours. The expression levels of ICAM-1, mlinRasGEF1B and mcircRasGEF1B were measured by qRT-PCR. (C) RAW264.7 cells were knocked down with ASO I or control ASO and induced with LPS for the indicated time periods. The expression levels of ICAM-1, mlinRasGEF1B and mcircRasGEF1B were measured by qRT-PCR. (D) Schematic depiction of the inducible shRNA construct targeting the back-splice junction of mcircRasGEF1B. (E) A stable RAW264.7 clone carrying the shRNA construct was induced with 2.5 μg of Doxycycline for 2 days before treatment with or without LPS. The expression levels of ICAM-1, mlinRasGEF1B and mcircRasGEF1B were measured by qRT-PCR. (*, p < 0.05; **, p < 0.01). Experiments were carried out in duplicates, n = 2 (B,C) and triplicates, n = 3 (E). (F) RAW264.7 cells were knocked down with control ASO, ASO I, and ASO II and then induced with or without LPS for the indicated time periods. Whole cell extracts were immunoblotted with the indicated antibodies. Intensity of bands was quantified using Image Lab (Biorad) software normalized to α-tubulin and shown in relative to 0 minute control ASO. (CA: control ASO, AI: ASO I, AII: ASO II). This is a representative data from 3 independent time course experiments.