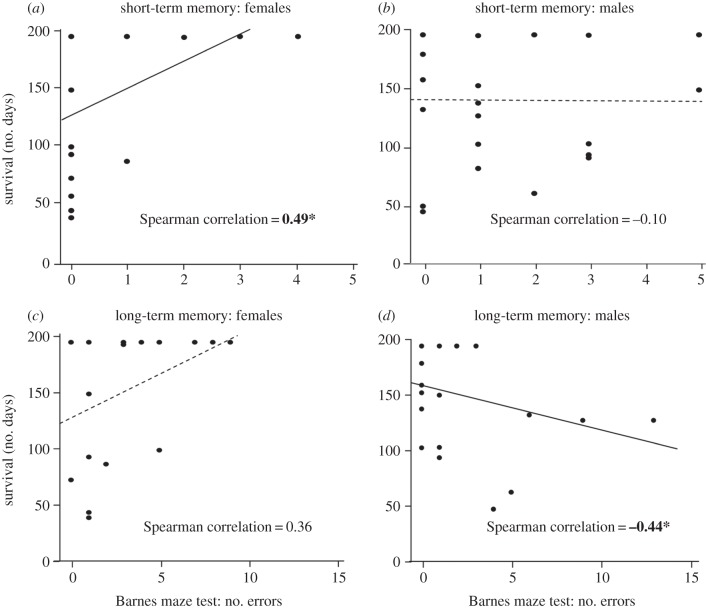
Figure 2.
Correlations between number of days mice survived from 1 January to 15 July and number of errors prior to locating the correct hole in the short-term spatial memory trial for (a) females and (b) males, and in the long-term spatial memory trial for (c) females and (d) males. Lines represent the linear regressions; solid line: p < 0.05, dashed line: p > 0.05. Bold values with asterisks denote Spearman correlations: p < 0.05.

