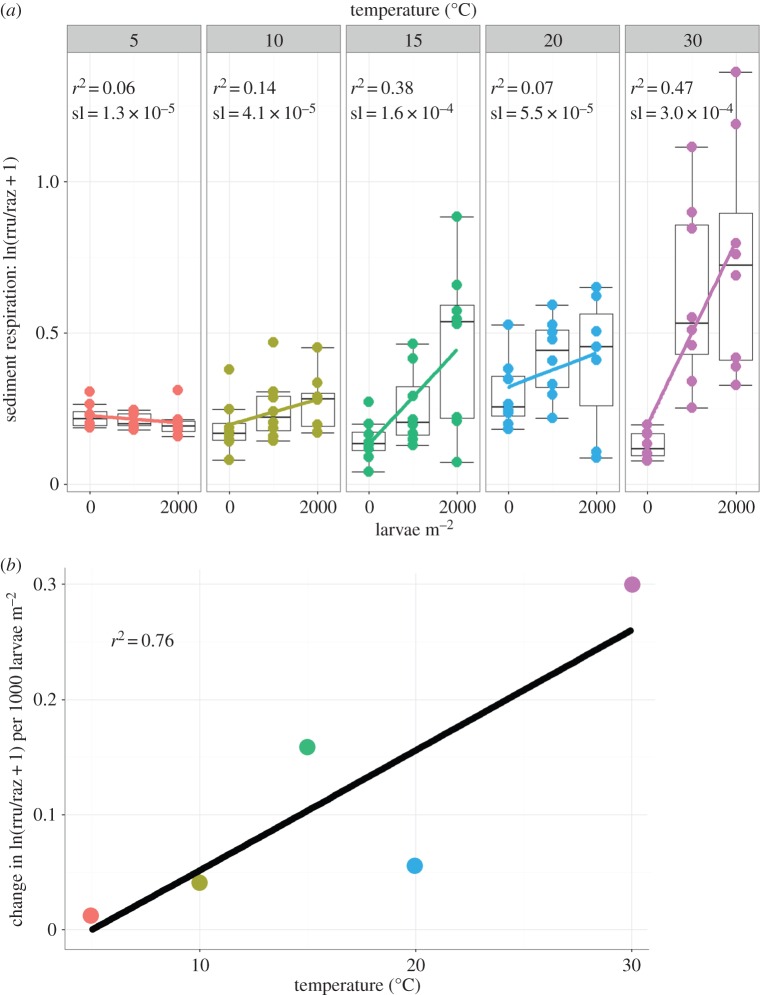
Figure 2.
(a) The impact of increasing chironomid larval densities on sediment respiration at different temperatures, with raz being the concentration of resazurin and rru the concentration of resorufin, and ln(rru/raz + 1) indicating resazurin turnover (n = 8 for each density and temperature). Differences between sediment respiration rates for different larval densities and at different temperatures are indicated by the slopes (sl) of linear regression lines. (b) The water temperature regulates the impact of chironomid larvae's bioturbation on sediment respiration. The slopes of the regression lines from (a), showing the impact of larval density on respiration at a given temperature, are plotted against experimental temperatures. (Online version in colour.)

