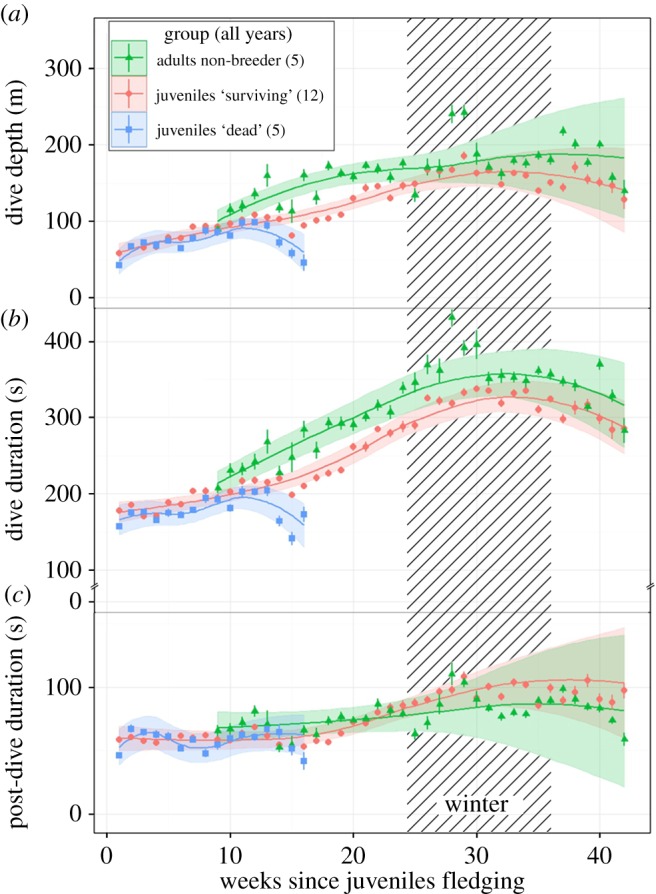
Figure 1.

Weekly means (±s.e.) of dive depth (a), dive duration (b) and post-dive duration (c), with fitted value lines ±2s.e. (colour ribbon) of the best mixed models for each group (for both years). Fitted values of mixed models present a quartic effect of time for each group.
