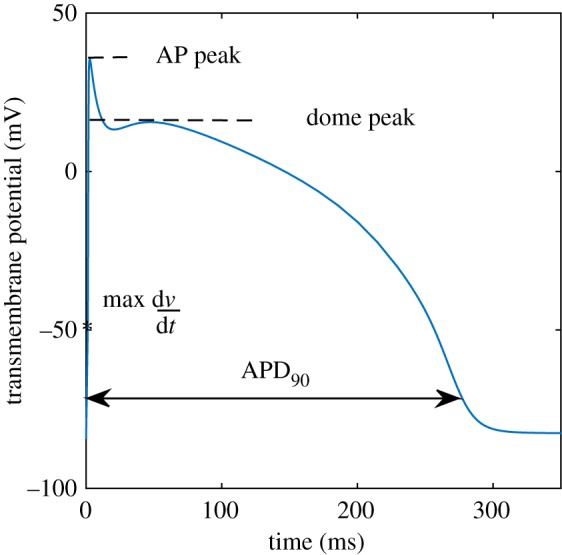
Figure 1.

The action potential profile generated in the BR model by applying the stimulus  at t = 0 for two consecutive milliseconds. The four biomarkers are: the action potential peak, the dome peak, the APD90 and the maximum upstroke velocity (max
  ) during the quick depolarization phase. (Online version in colour.)
